PlotlyAddTraces
Wolfram Kernel
Execution environment
PlotlyAddTraces[p_PlotInstance, {data_Association} | _Association]
appends to a plot p new data specified in data.
tip
See the official reference
Example
Plot an example data
p = Plotly[<|
  "x" -> Range[100],
  "y" -> Table[Sin[2Pi x / 100.0], {x,100}],
  "mode" -> "line"
|>]
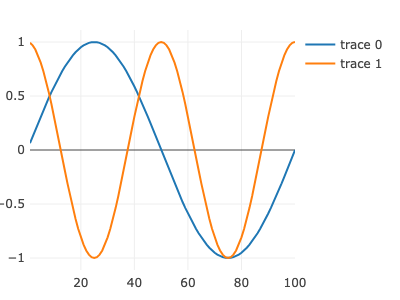
To dynamically add new traces, we can call directly
PlotlyAddTraces[p, <|
  "x" -> Range[100],
  "y" -> Table[Cos[4Pi x / 100.0], {x,100}]
|>]