Overview
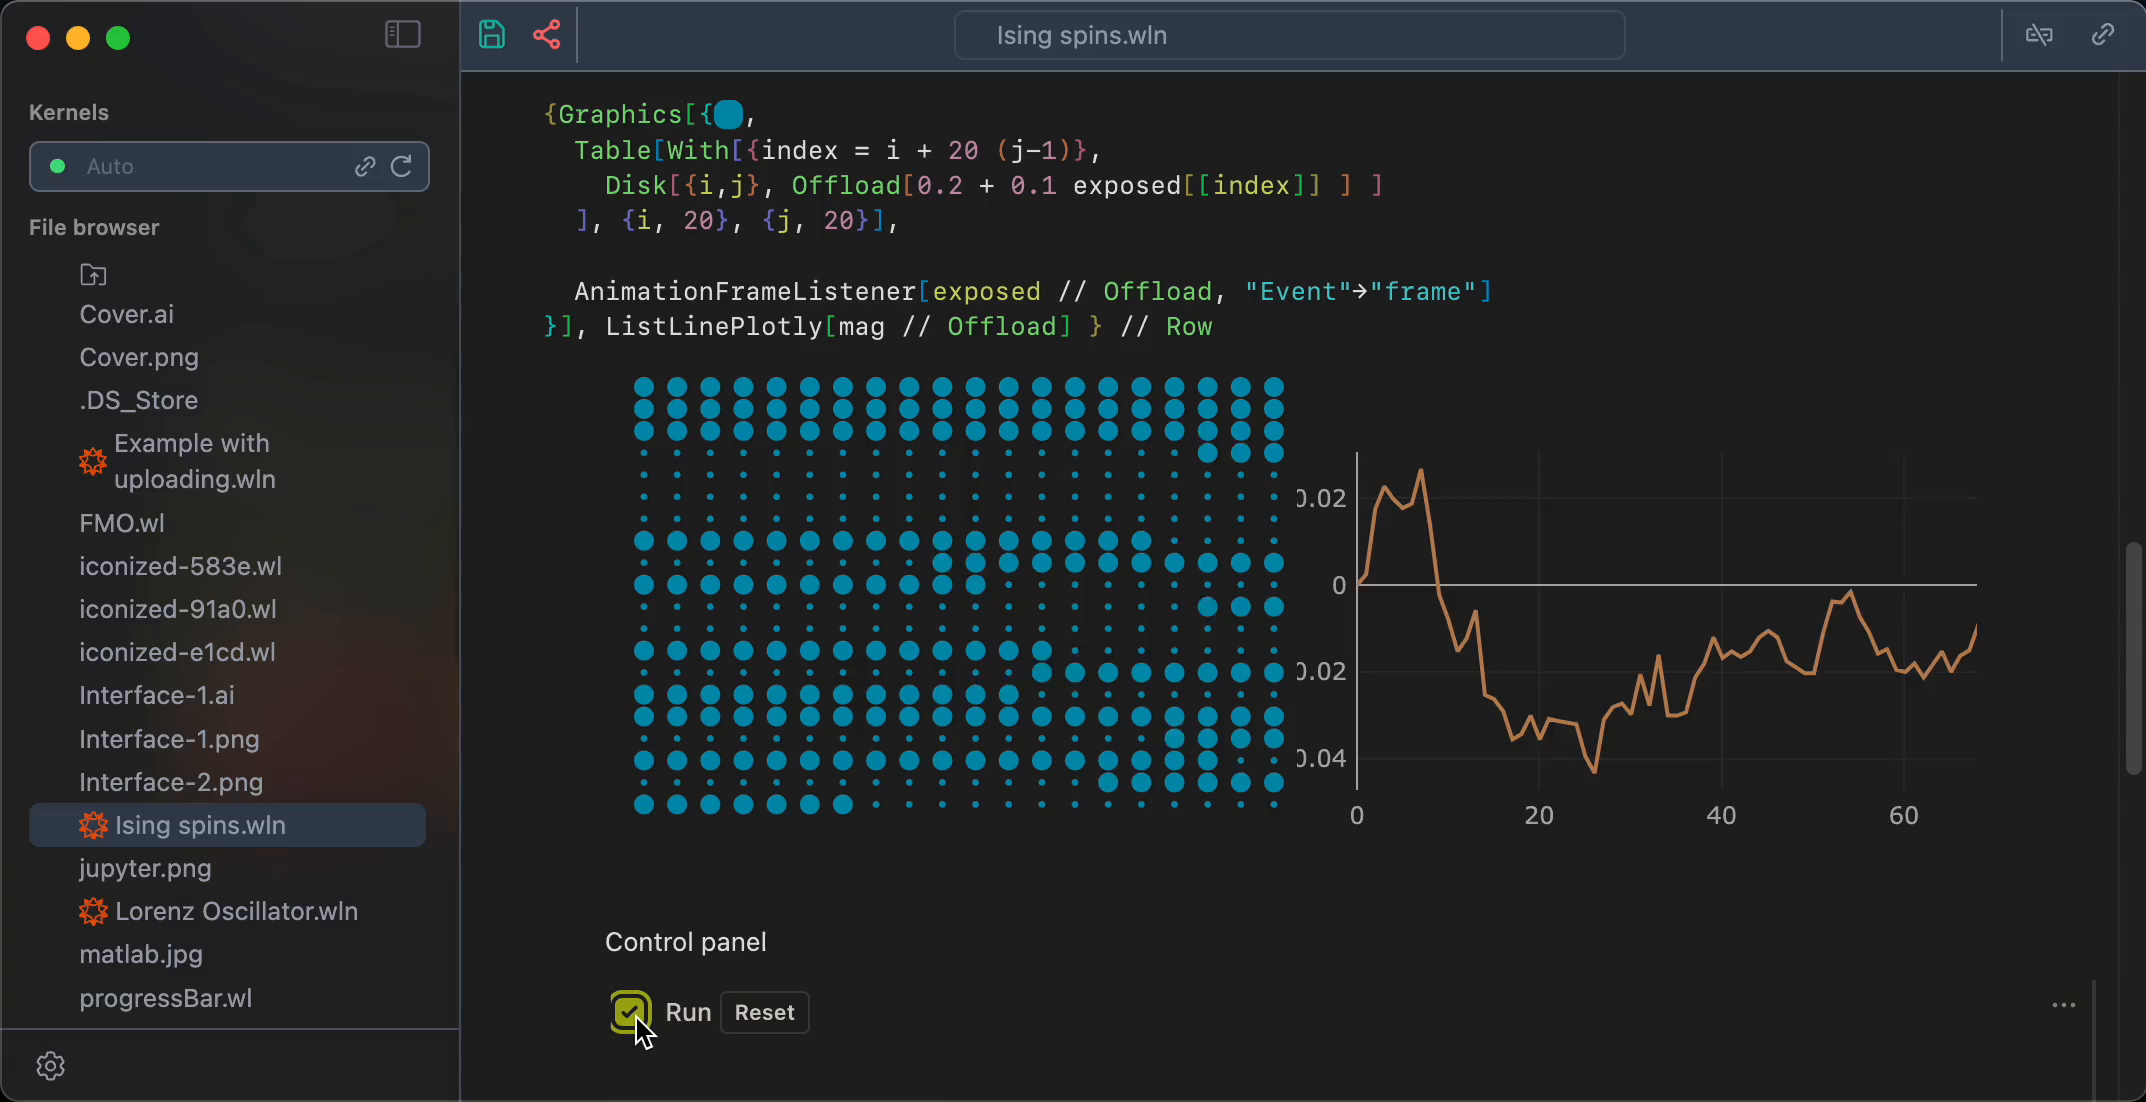
The whole notebook interface is made using plain Javascript, HTML powered by a Wolfram WebServer and WLX running locally on a Wolfram Kernel. It means you can work remotely by running a server anywhere you want (see how at instruction).
Some calculations are performed partially by your browser, you can have a control over it, if you want. All UI elements, cells operations are written in Javascript and Wolfram Language and performed by WLJS Interpreter
WLJS Interpreter is a tiny (3 kB) Wolfram Language Interpreter running in a browser and written in vanilla Javascript. It fully interconnects Javascript world with Wolfram Language on the server (backend). We will also reference it as frontend.
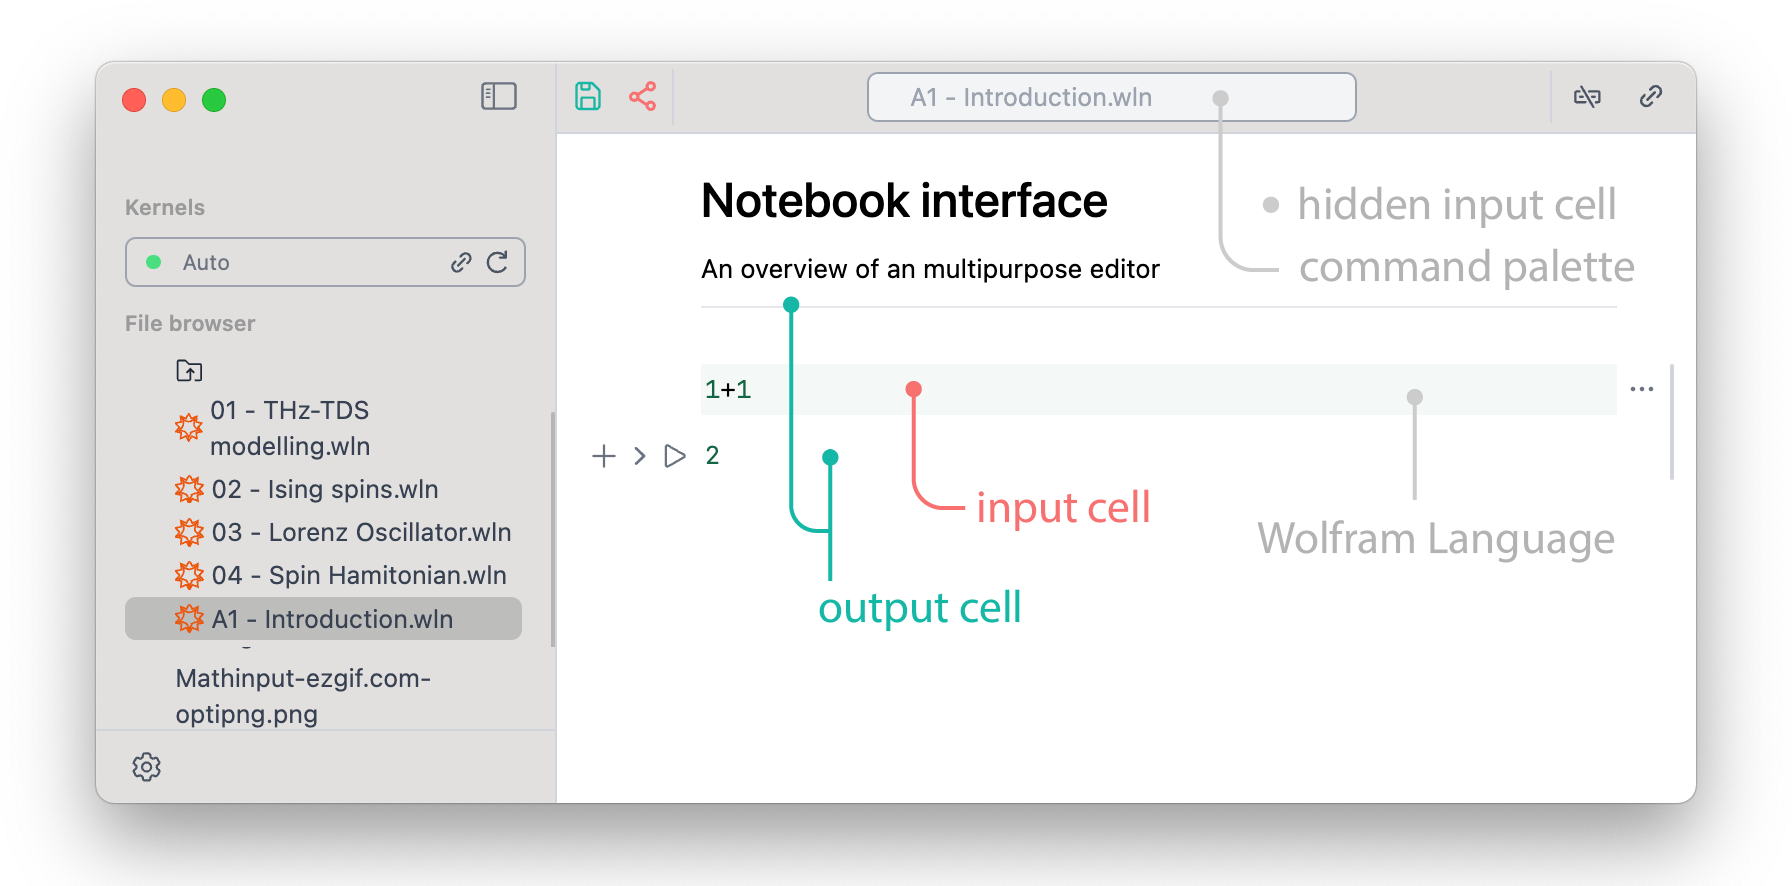
Compared to Mathematica the cell design has mostly flat structure similar to Jupyter Notebook. Only input and output cells are joined into groups.
Output cells are editable. We do not separate them explicitly unlike in Mathematica or Jupyter, since the whole document is a notebook, notebooks do not have inputs and outputs. You can freely edit, copy, reevaluate in place any output expression. Therefore we distinguish them only formally.
Cell control buttons
All cells are grouped by parent input cell, apart from that the structure of the notebook is flat. The controls are applied to the whole group

From left to right
- add new cell below
- hide an input cell
- evaluate (also
Shift+Entercombo) - more
The last options expands into
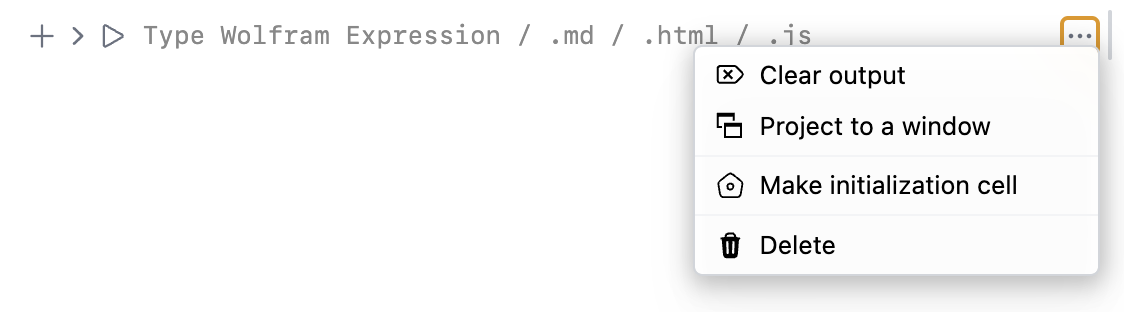
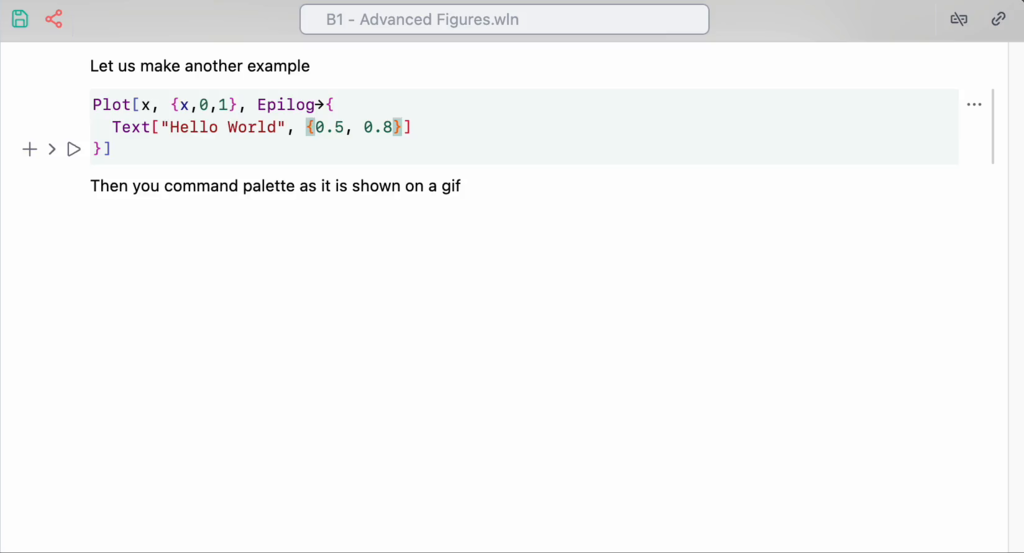
Project to a window is the most interesting feature here, that allows to evaluate a cell in a new window. It comes handy while demonstrating presentations.
Shortcuts
working in both: browser and desktop application
UI
Ctrl+S,Cmd+Ssave notebookAlt+.,Cmd+.abort evaluationCtrl+P,Cmd+Popen command paletteShift+Enterevaluate current cellCtrl/Cmd + fsearch in the focused cellShift + Alt + Spaceoverlay window (Desktop App only)
Cells
Ctrl+W,Cmd+2hide/show input cellCtrl+/make fraction on selectedCtrl+6make superscript on selectedCtrl+2make square root on selectedCtrl+-make subscript on selectedAlt/Cmd+/comment a line
See more keybindings in Input cell
Wolfram Language
When you start typing the language you are using assumed to be WL. By pressing Shift+Enter (or play button) you can start evaluation
Output cells are joined to the input and the last one can be hidden by clicking on the sign on the left side from the cell.
Once you change something inside the output cell, it loses its formal parent and becomes new input cell, like in Mathematica.
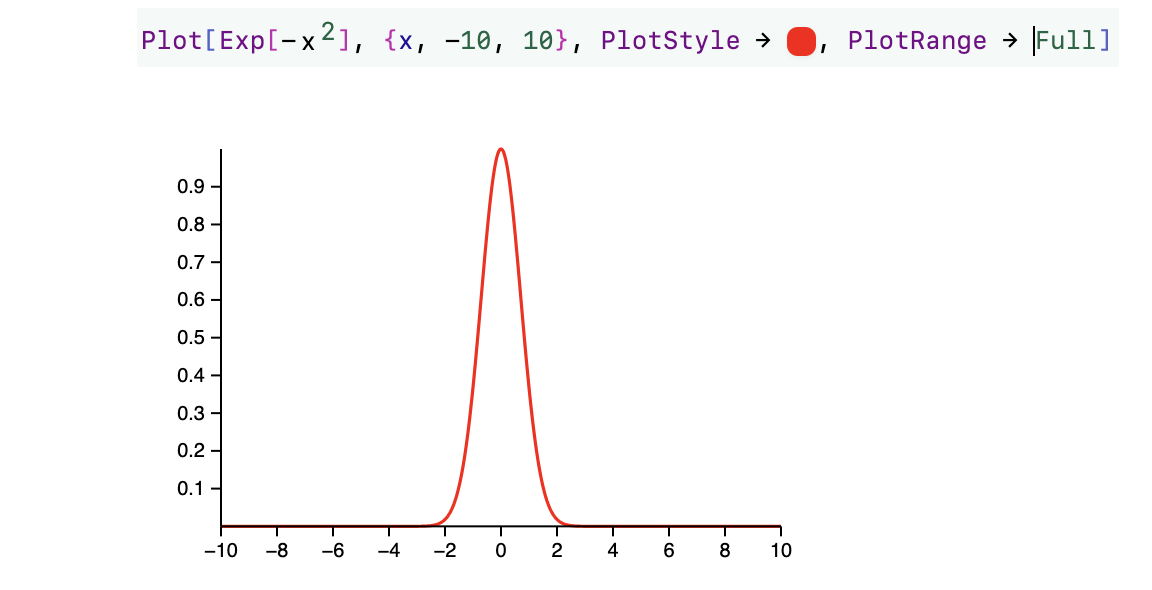
Syntax sugar, fractions and other 2D input are supported

The most useful commands are listed below
Ctrl+/fractionCtrl+^powerCtrl+-subscriptCtrl+2square root
Or using a special toolbar (snippet)
Now let us move to some other gems
What differs from Mathematica 💡
If you are familiar with Wolfram Language, it will be easier to use WLJS Notebook. Output cells are also editable (unlike in Jupyter-like interfaces), syntax sugar for math-expressions, graphics and other objects is full supported. Here is a full list
- 2D math input (using shortcuts or command palette)
- Graphics, Graphics3D, Sound, Video and etc
- Most plotting functions (tested are presented in Reference)
- Standard Wolfram Packages / Paclets
- Resource functions
- Neural networks
- Formatting options (limited)
We partially support Mathematica notebook format. However, you should consider the differences
- Limited support for formatting (see available Decorations section in Reference)
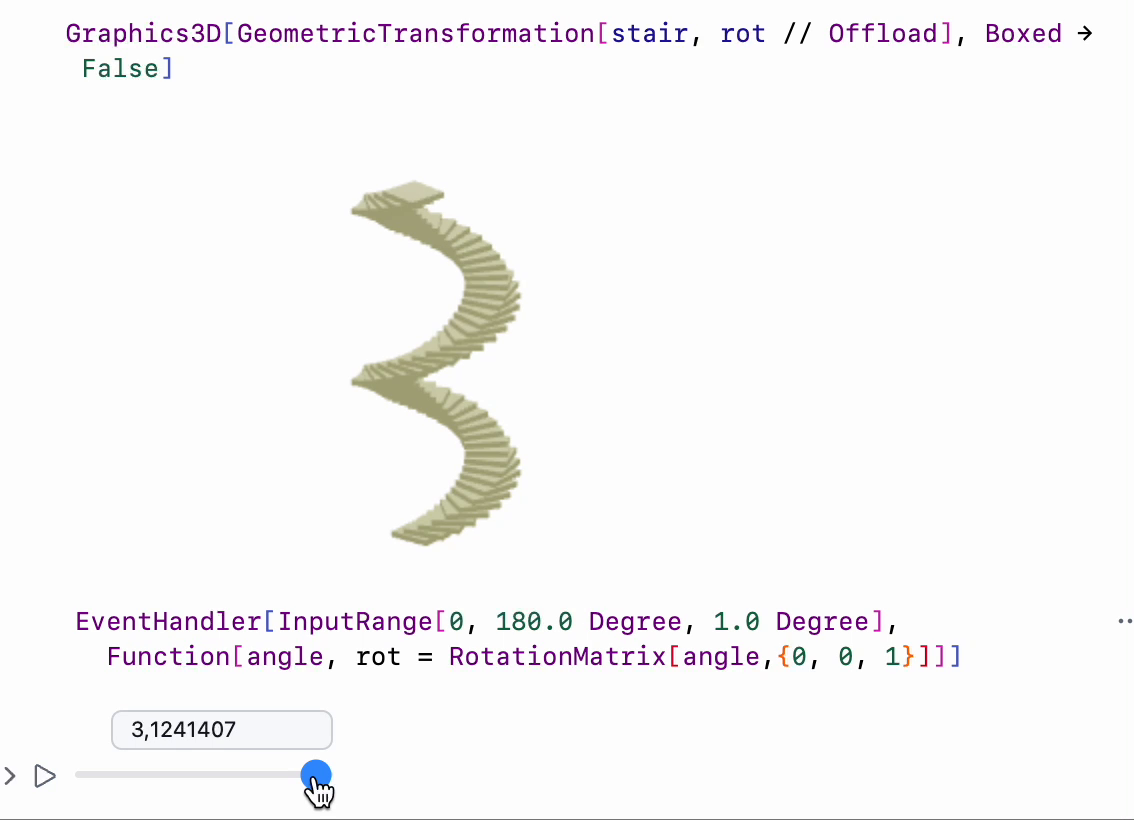
- Different dynamics implementation
- No
DynamicModule, noSlider, noButton. Instead use InputRange, InputButton - Flat notebook structure
- Markdown is a main language for text cells (see Markdown)
- No extended evaluation history (only last output)
- Not all graphics primitives are implemented, some plotting functions might not work (usually we fix it gradually)
See Advanced section for more information.
Why not Jupyter Ecosystem
There are strong reasons behind our decision to built our own system:
- there is already a Jupyter Kernel for Wolfram Engine;
- we want to bring syntax sugar for writing equation, editable output cells, put images, sound or other formats inside cells, which requires a custom cells editor;
- Jupyter uses an indirect
ZMQlink for communication, which does not meet the requirements for fast- and low-latency dynamics with a heavy payload; - bringing 3rd language to the table as well as frequently changing API requires more maintenance in the future.
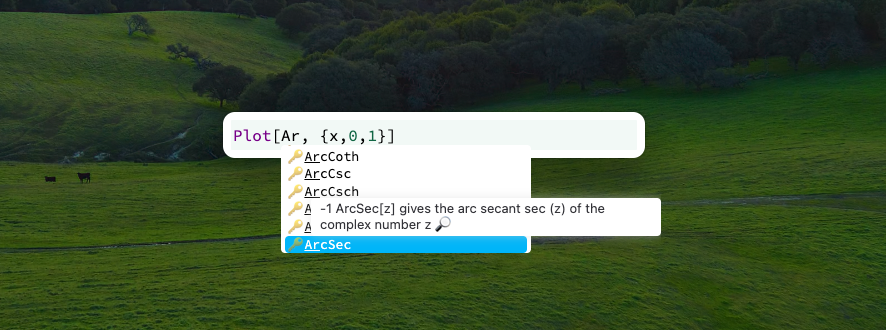
Command palette
See more here Command palette
To help in writing matrixes, colors, and some other useful stuff are accessible by the shortcut Super/Cmd+P
All snippets are just special kind of notebooks including all UI elements.
Editor of Power
A single input cell can produce Wolfram Language output, HTML page, Javascript window or a slide of a presentation
Or just draw something inside the code editor
Overlay mode
While running WLJS App (in a tray or normally) press Shift+Alt+Space to get quick access to WLJS input cell
See more in Overlay mode
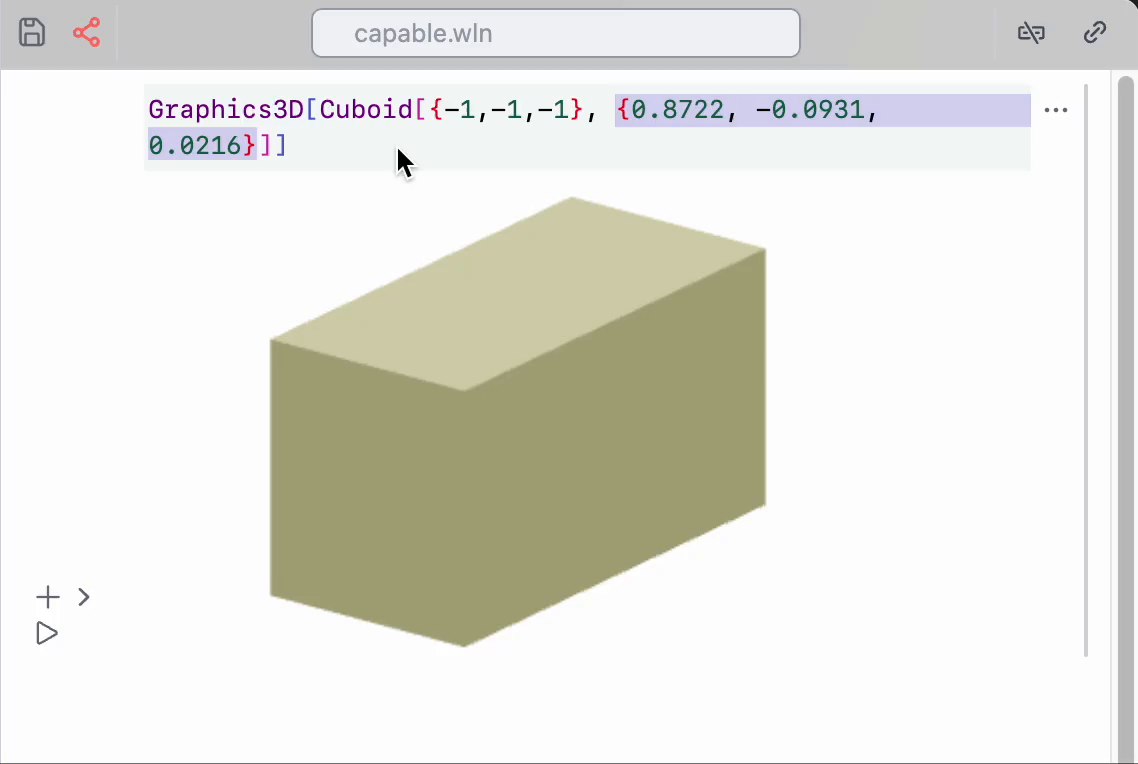
Graphics 2D & 3D
Most Mathematica's plotting functions produces lower-level primitives. The major part of them are supported
Try to drag and pan using your mouse!
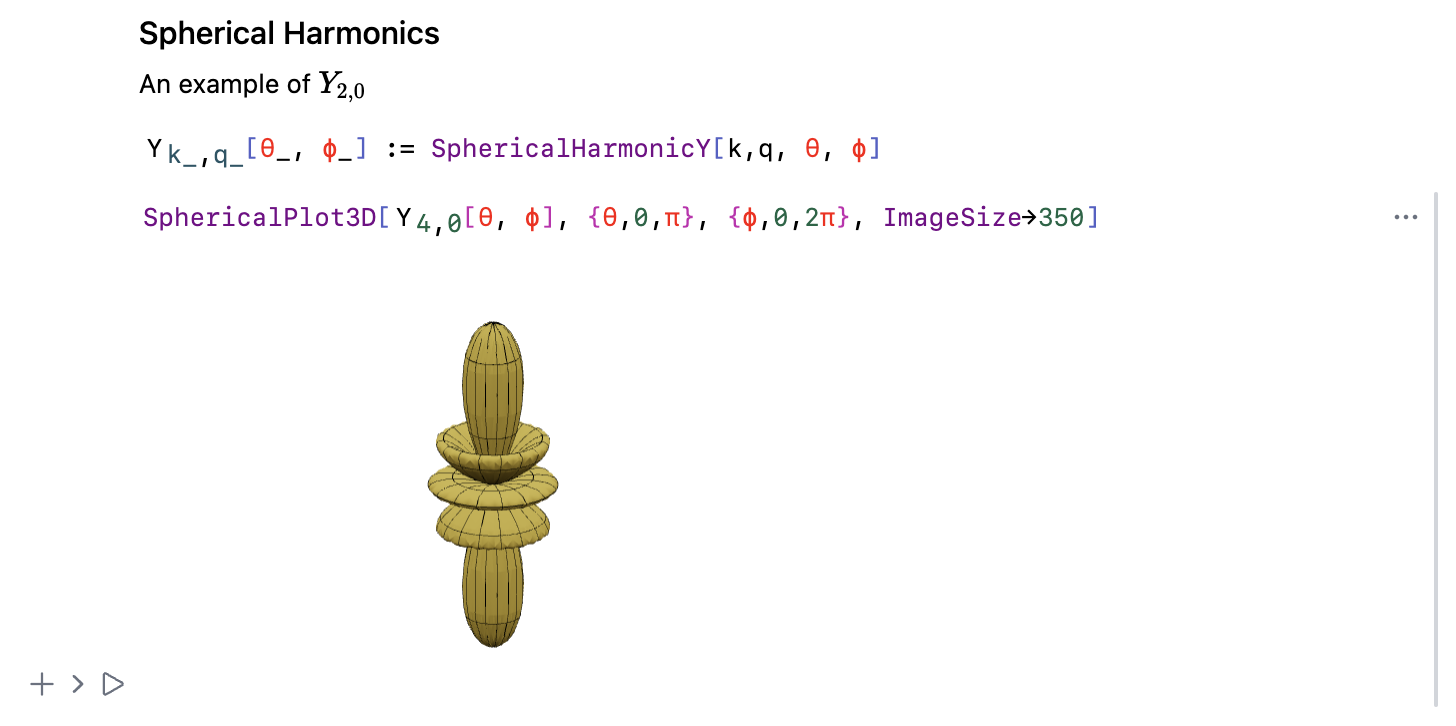
Powered by SVG and WebGL

Portability
You will probably need to share your notes with someone. Here we have a bunch of options:
- Export entire notebook as a web-page Static HTML, Dynamic HTML
- Export individual figures Figures
- Make a presentation Slides
No internet dependency, it will work permanently and will not be broken by any update in the future You can always convert back the exported notebook if needed, which is perfect if you want to share your notes on your personal blog.
Other languages
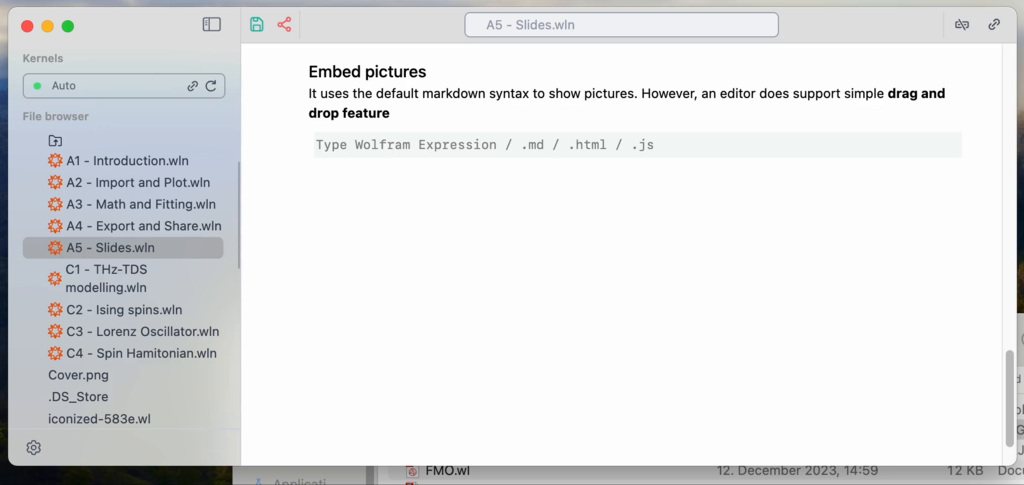
Of course the notebook interface is impossible to use without text annotation, here you do not need to switch to a different cell type. To use you favorite (or not) Markdown type in the first line of a cell .md and magic happens
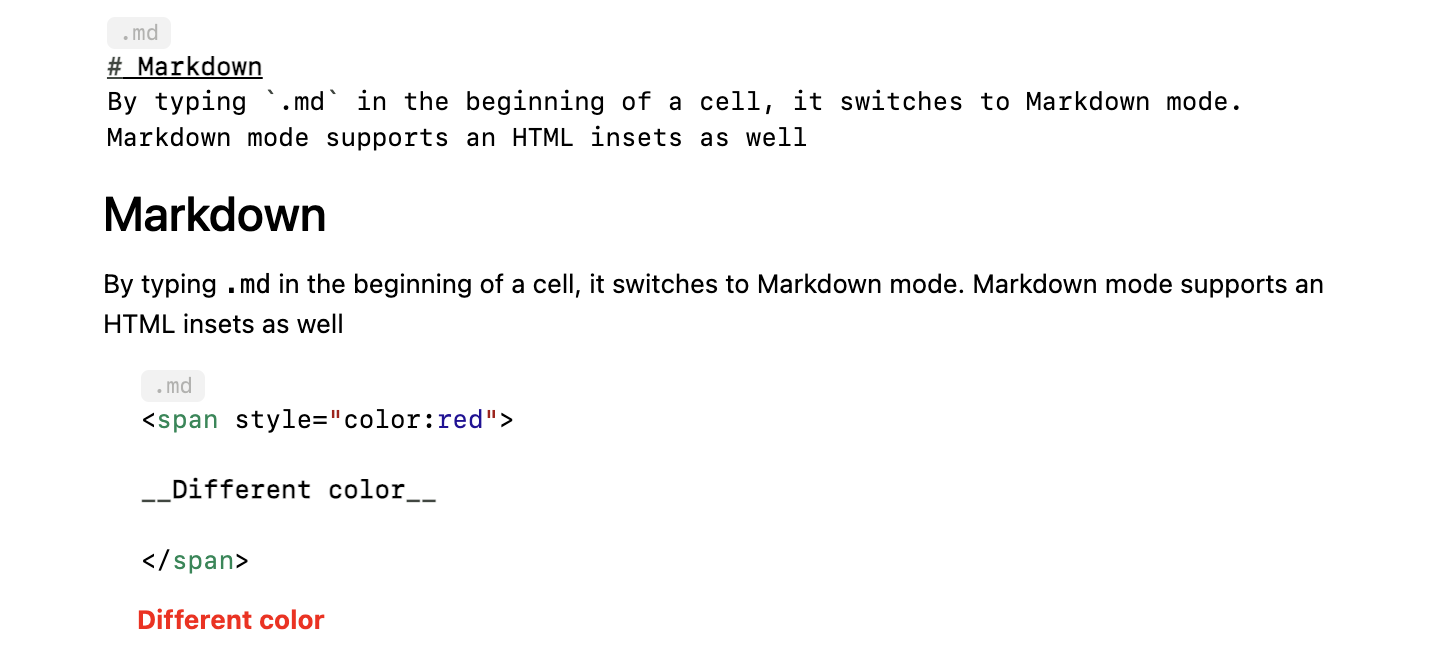
By clicking on an arrow on the right, you can hide the source cell and only the output will be displayed. An editor is very flexible you can quite easily add your custom output cell support.
Or combine WL together with Javascript to visualize your data in incredible way
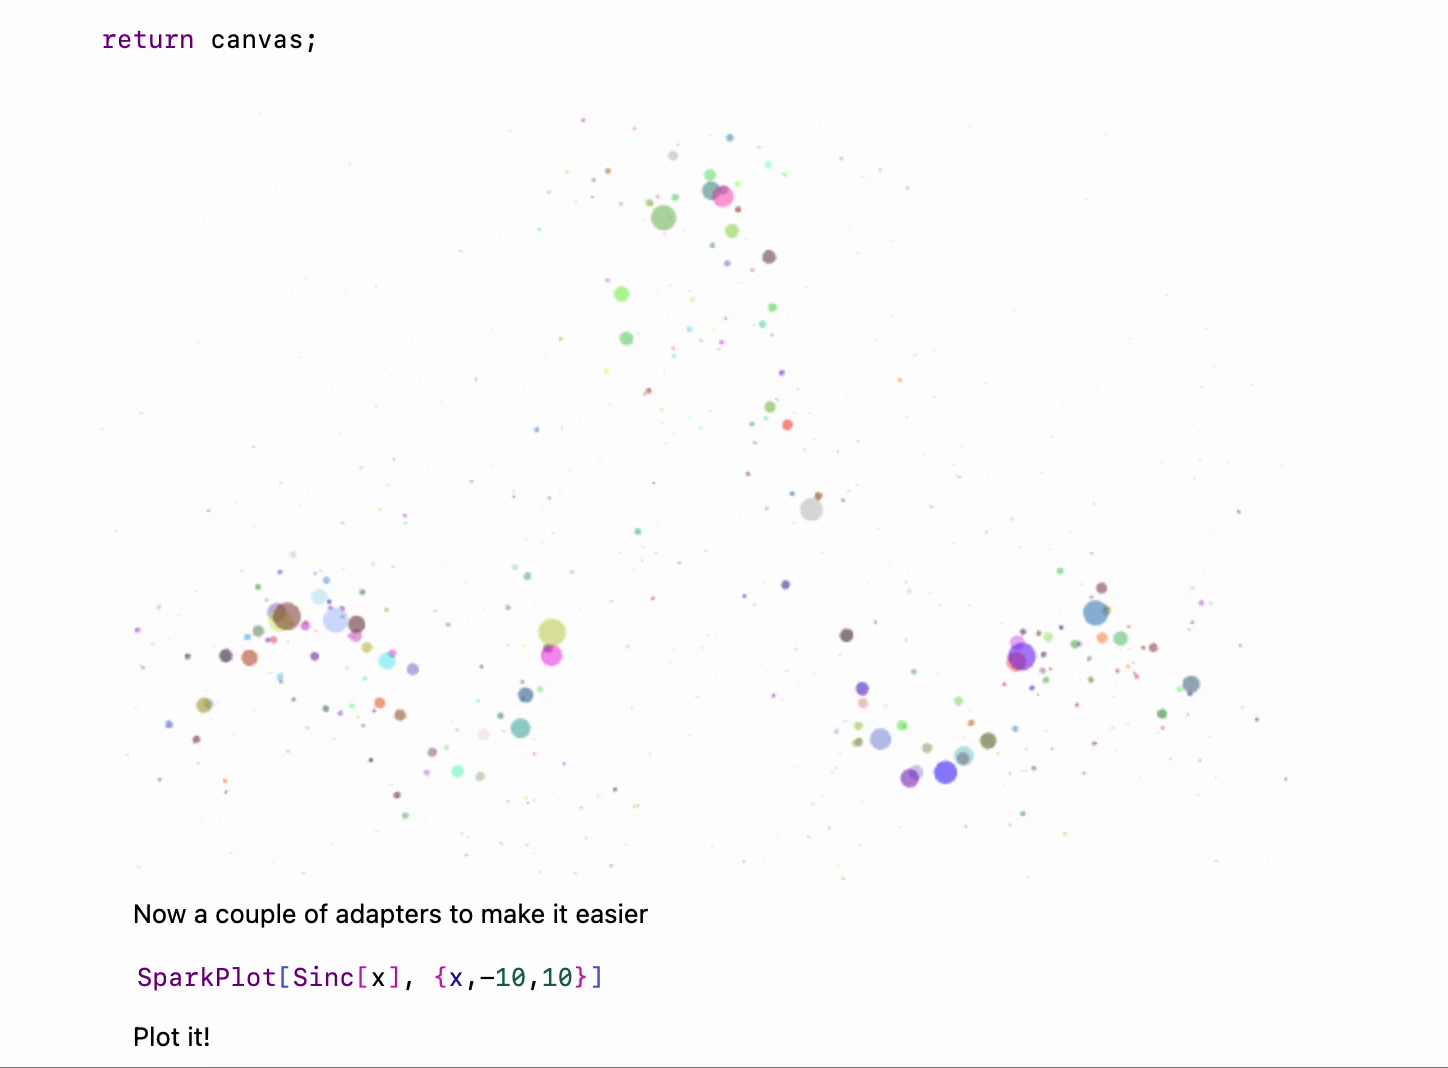
The core plugins provides the following cells
- Javascript
- Markdown
- FrontSlidesSelected
- WLX
- Files
- HTML
- Many more (Mermaid)
Debugger
It also available from the command palette
See more Debugger here.
AI Copilot
See it in action there AI Assistant