Slides
You can use pure Markdown, HTML, CSS or WLX languages while making slides
This is provided by wljs-revealjs, that integrates an amazing framework RevealJS and WLX language to provide components approach on making presentations as well as adding interactivity to them and basically all features of frontend's cells.
The aim of this approach is to simplify the process of making slides, decouple the content from its appearance and embrace the power of data-driven slides.
If you know the basics of Markdown it is already enough to do a lot
.slide

# Title

Content
Slides can be separated in two ways
- using
---in the same cell
.slide

# Slide 1

---

# Slide 2
which is super simple, however becomes unreadable on larger slides.
- using separated cells
.slide

# Slide 1
.slide

# Slide 2
and then merge them using .slides extension
.slides

Could the the final slide. All previous slides will be added before.
The position of .slides cell in the notebook does not play any role.
To go fullscreen mode - press f key after focusing on the content of a slide
Use projector feature
to show slides in a separate window
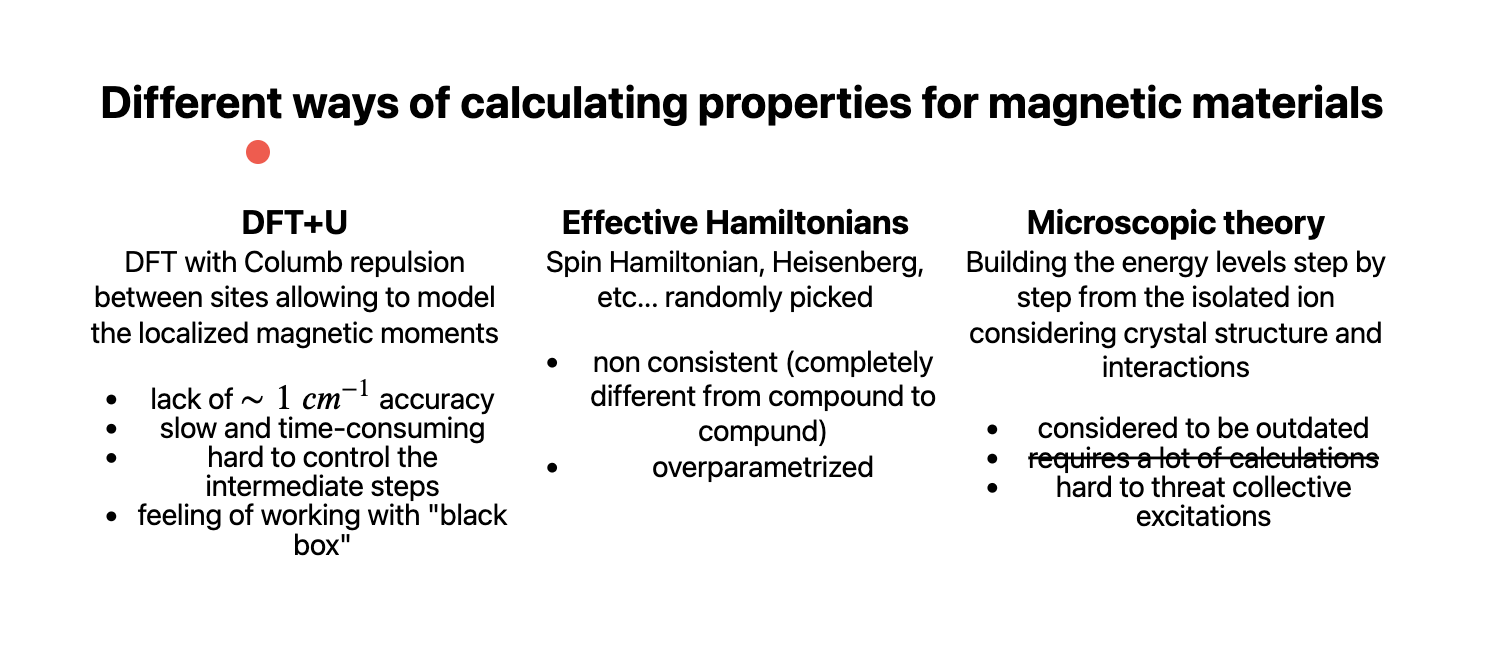
Layout
It is not opinionated on how you organize the content on the slide. By the default all titles marked as #, ## etc are centered and obtain standard h1, h2 ... HTML tags. All paragraphs are wrapped with p behind the scenes.
If you need two columns, use HTML and any available method to make columns. For instance using flex
.slide

# Title

<div style="display: flex">
  <div style="width: 50%">

## Subtitle 1

And some content

  </div>
  <div style="width: 50%">

## Subtitle 2

And some content

  </div>
</div>
To use Markdown in HTML, please, add line breaks before and after
The result looks like this

In order to mix Markdown with HTML or WLX correctly, remove white spaces from the beginning markdown, i.e.
.slide

<div>
	# It wont work
</div>
but instead
.slide

<div>

# It will work

</div>
Using WLX
Of course one can make a helper function for it
.wlx
Columns[Col1_, Col2_] := With[{},
	<div style="display: flex">
		<div style="width: 50%"><Col1/></div>
		<div style="width: 50%"><Col2/></div>
	</div>
]
and then
.slide

# Title

<Columns>
  <div>

## Subtitle 1

And some content

  </div>
  <div>

## Subtitle 2

And some content

  </div>
</Columns>
The result will be the same. Additional tags we used div are necessary to help WLX to differentiate between the first and the second arguments of Columns similar to how li and ul tags are used to make lists.
See advanced guide on components by the link components
Images
RevealJS uses standard Markdown notations for images
.slide
# Title


You can drag and drop them from anywhere

Local files are also supported
.slide

A web server will try to locate example.png in the directory where the notebook is located. If there is no file, it tries to use it as global path starting from the root folder of a system disk.
Regular HTML img tag is supported as well. It comes handy if you need to set the size
.slide

<img width="700" src="https://upload.wikimedia.org/wikipedia/en/a/a9/Example.jpg"/>
Equations
This is provided by well-known KaTeX library. Use it as a normal LaTeX
.slide

$m \\mathbf{a} = \\mathbf{F}$
A single slash notation is reserved originally by WL Kernel, therefore you have to stick to double slashes \\
or a multiline
.slide

$$
\\begin{bmatrix}
m \\mathbf{a} = \\mathbf{F}
\\end{bmatrix}
$$
If you need to highlight WL code, or JS, or HTML - see embed-wl.
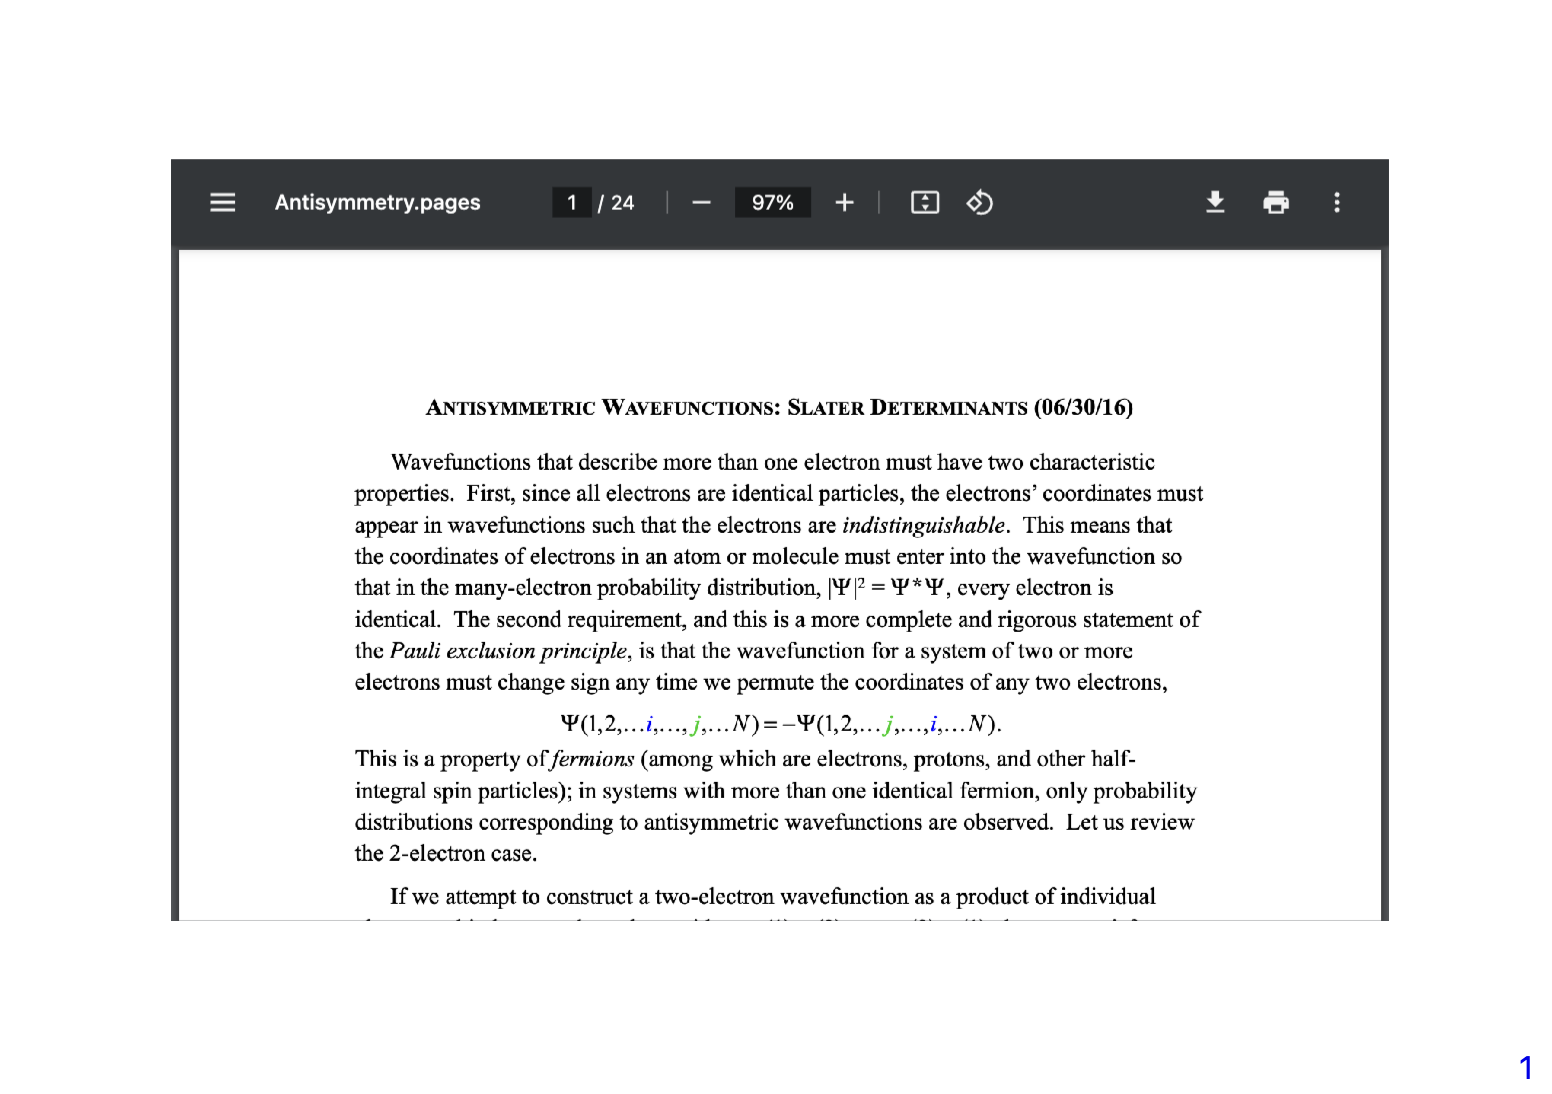
Embedding PDF or websites
We have a full power of HTML. To embed a local PDF document from the folder of your notebook
.slide

<embed width="800" height="500" src="antisymmetry.pdf"/>
or the whole website
.slide

<iframe width="800" height="500" src="https://chat.openai.com"/>

and to make a nicer corners
.slide

<iframe style="border: none; border-radius: 4px" width="800" height="500" src="https://chat.openai.com"/>
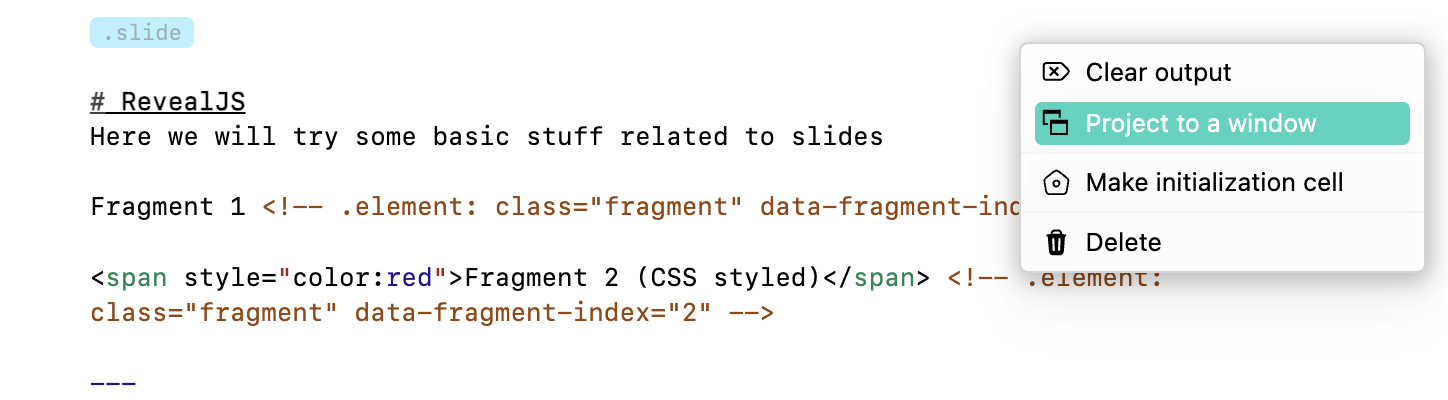
Transitions and fragments
Revealing the content is an art. You can specify some fragments to appear later, or disappear or change the color. RevealJS uses HTML comments in the form
<!-- .element: class="fragment ACTION" data-fragment-index="INDEX" -->
For example to reveal 1 by 1 in order
.slide

# Slide

Fragment disapear <!-- .element: class="fragment fade-out" data-fragment-index="1" -->

Fragment appear <!-- .element: class="fragment" data-fragment-index="2" -->

Fragment changes the color <!-- .element: class="fragment highlight-red" data-fragment-index="3" -->
See more available transitions at RevealJS.
Custom transitions are not supported, unless it is made using Graphics using animations approach
Events
To capture the events from a slide (revealing the slide or revealing individual fragments) - use SlideEventListener
It attaches itself to the slide, where it has been placed
.slide

# 1st Slide
Nothing

---

# 2nd Slide
A message pops up

Another message <!-- .element: class="fragment" data-fragment-index="1" -->

<SlideEventListener Id={"myEvent"}/>
Before evaluation, you should attach an event handler (EventHandler) to it
EventHandler["myEvent", {
	"Slide" -> (Print["Hey there!"]&),
	"fragment-1" -> (Print["Hey there from fragment!"]&)
}]
The identifier of SlideEventListener acts as an event object. There are two patterns on how you can capture certain event
"Slide"- is fired when a slide has been revealed"fragment-INDEX"- is fired when a fragment numberINDEXhas been revealed
To learn more about on how to utilize it for animations and etc, please, read animations section.
WL expressions and data-driven slides
This is just a simple demonstration. Using WLX one can directly write and execute any WL expressions on a slide
GetTime := TextString[Now];
.slide

# Using WLX
Allow you to do some cool stuff

Your local time is __<GetTime/>__

Or embed any graphics object
Figure = SphericalPlot3D[SphericalHarmonicY[2,0, t,p], {t, 0, Pi}, {p, 0, 2Pi}];
.slide

# Embed some figures
Even 3D

<div style="text-align: center; display: inline-flex;">
  <Figure/>
</div>

Try to move it using your mouse

as well as some figures plotted from a local CSV file. In the example below we use random list of points to do some simple computations
pts = RandomReal[10, {100, 2}];
Figure = ListLinePlot[pts[[Last@FindShortestTour[pts]]], Epilog->{Point[pts]}]
.slide

Compute and plot the shortest tour through 100 random points:

<Figure/>
For more advanced stuff see animations
Pointer
Pointer is provided by a separate plugin used by RevealJS. To toggle it press q when the focus is on a slide