Graphics
Graphics[objects_, opts___]
represents a two-dimensional graphical image. This is a fundamental expression, which is produced by all 2D plotting functions
Graphics[
 Table[{Hue[t/20.0,1., 0.5], Circle[{Cos[2 Pi t/20], Sin[2 Pi t/20]}]}, {t, 20}]]
Graphics[{EdgeForm[Black], Green, Rectangle[{0, -1}, {2, 1}], Red, Disk[], Blue,
   Circle[{2, 0}], Yellow, Polygon[{{2, 0}, {4, 1}, {4, -1}}], Purple, Arrow[{{4, 3/2}, {0, 3/2}, {0, 0}}], Black,
  SVGAttribute[Line[{{-1, 0}, {4, 0}}], "stroke-dasharray"->"3"]}]
The engine that interprets graphical data is a separate Javascript library.
Graphics objects
Please see the corresponding section in Reference section for expression to be used with Graphics.
Mostly all primitives are generated by a high-order functions like Plot, ListLinePlot, ListVectorPlot, BubbleChart and etc
Context
Here is a list of utility symbols used in Graphics context
Graphics`Canvas
Is used to have an access to SVG container of Graphics function
Methods
EventHandler
Is used to capture various events such as
"mousemove""click"
For example
pt = {0,0};
Graphics[{
	EventHandler[Graphics`Canvas[], {
		"mousemove" -> Function[xy, pt = xy]
	}], Red,
	Circle[pt // Offload, 0.08]
}, PlotRange->{{-1,1}, {-1,1}}]
See more in Mouse and keyboard
Options
PlotRange
manually specifies, where the borders of the visible area (viewport) are
PlotRange->{{-1,1}, {-1,1}}
If PlotRange is missing, WLJS Graphics will try to guess the dimensions in order to fit all objects to the screen
ImageSize
specifies the actual size in pixels of a canvas
ImageSize->300 or ImageSize->{300,200}
ImagePadding
removes or adds the spacing between the plotted range and the canvas border
ImagePadding->None
ImagePadding->10
PlotLabel
Specifies a label for a plot
Plot[Sin[x], {x, 0, 10}, PlotLabel -> Offset["Sin[x]", {0,-1}], LabelStyle -> Directive[Orange, FontSize->14]]
can be used with Offset as well
Axes
Show or hide axes
Axes->True
Example
Graphics[{EdgeForm[Black], Green, Rectangle[{0, -1}, {2, 1}], Red, Disk[], Blue,
   Circle[{2, 0}], Yellow, Polygon[{{2, 0}, {4, 1}, {4, -1}}], Purple, Arrow[{{4, 3/2}, {0, 3/2}, {0, 0}}], Black,
  SVGAttribute[Line[{{-1, 0}, {4, 0}}], "stroke-dasharray"->"3"]}, Axes->True ]
AxesLabel
Place labels on your axes
AxesLabel -> {"xxx", "yyy"}
Activate Axes option first
for example
Labels accepts only strings or numbers unlike Mathematica, where you can put everything.
Since it is translated into Text, one can use sort of TeX math input
Graphics[Circle[], Axes->True, AxesLabel -> {"x-axis (cm^{-1})", "y-axis \\alpha"}]
It also supports Offset attribute
Graphics[Circle[], Axes->True, AxesLabel -> {Offset["x-axis (cm^{-1})", {0,0.5}], "y-axis \\alpha"}]
Ticks
Customize ticks by providing an array of numbers for both axes
Graphics[Circle[], Axes->True, Ticks->{{0, 0.5, 1}, {}}]
Or by providing as pairs {Number, String} one can specify the displayed text
Graphics[Circle[], Axes->True, Ticks->{{{0, "Zero"}, {0.5, "Half"}, {1,"One"}}, {}}]
Controls
The features allows to pan and zoom your plots, that was never possible in Mathematica
Controls->True
Try to use your mouse here
from the latest update, this is True by the default
Frame
Turns plot into the journals-like styled graph. In general it has much more options to customize the look
Graphics[Circle[], Axes->True, Frame->True]
FrameTicks
The same as Ticks, but for this regime.
FrameLabels
The same as AxesLabel
FrameLabel->{{"yy", None}, {"xx", None}}
FrameStyle
Affects the style of FrameLabels. Use Directive for changing the style
FrameStyle->Directive[FontSize->16]
FrameTicksStyle
Affects the style of FrameTicks
FrameTicksStyle->Directive[FontSize->16]
TickLabels
To remove unnecessary ticks, use
TickLabels->{{True, False}, {True, False}}
Epilog
Puts any graphics object on top
Epilog->{Red, Line[{{-1,-1}, {1,1}}]}
It opens up many possibilities, since it provides low-level access to the Graphics canvas.
Example
One can use it on a high-level function like Plot to add low-level primitives
Plot[Sin[x], {x,0,Pi}, Epilog->{Red, Line[{{-1,-1}, {1,1}}]}]
or together with MetaMarker
Prolog
The same as Epilog, but acts before plotting the data.
TransitionType
See Dynamics. The possible values
It can also be applied locally, see TransitionType
"Linear"
THE DEFAULT ONE
For example
pt = {-1,0};
Graphics[{PointSize[0.3], Point[pt // Offload]}, ImageSize->350, PlotRange->{{-1,1}, {-1,1}}, "TransitionType"->"Linear"]
pt = RandomReal[{-1,1}, 2];

"CubicInOut"
This one is used by the default
pt = {-1,0};
Graphics[{PointSize[0.3], Point[pt // Offload]}, ImageSize->350, PlotRange->{{-1,1}, {-1,1}}, "TransitionType"->"CubicInOut"]

None
No transition. Works great for fast animations
TransitionDuration
Sets the duration of any transitions of graphics objects on canvas in milliseconds. The default value is 300.
It can also be applied locally, see TransitionDuration
Combining two graphics plots
One can put Graphics into another Graphics canvas using [[frontend/Reference/Graphics/Inset]]
Dynamics
The time-dependent symbols (Dynamics) are supported on the level of graphics primitives such as Line, Point, Rectangle, Text and etc... Not all primitives do support dynamic updates, please, check individually.
The full reevaluation of Graphics does not happen, that allows to gain much more performance. However, since the dynamic binding is established between individual primitives and symbols, one can make nested constructions like this one
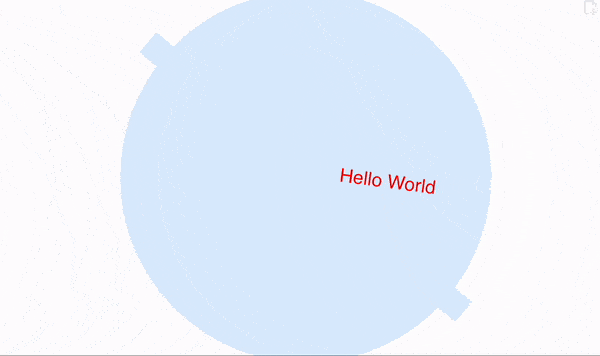
radius = 1.;
angle = 0.;
tpos = 0.

group = {
  LightBlue, Disk[{0,0}, radius // Offload],
  LightBlue, AbsoluteThickness[25], Line[{{-1,1}, {1,-1}}],
  Red, Directive[FontSize->24],
  Text["Hello World", {Offload[-0.23 + tpos],0}]
};

Graphics[Rotate[group, angle // Offload], TransitionType->"Linear", TransitionDuration->100]
Here
- an update of
anglewill not cause reevaluation ofgroup - and update of
radiuswill only update the radius ofDisk - and update of
tposwill reevaluate an expression-0.23 + tposand change the text position
Let us animate this example
Do[
  radius = 1+0.5 Sin[x];
  tpos = 0.5 Cos[4x];
  angle = x;
  Pause[0.1];
, {x, 0. , 2Pi, 0.1}];
The result will look like