Plotly
Plotly[f, {x, xmin, xmax}]
mimics the behaviour of a native Plot using a well-known PlotlyJS library. It is quite limited and does not support options.
Plotly[data_Association, layout_Association:Null] _PlotlyInstance
creates Plotly instance object, which gives a direct API access to a native Plotly Javascript engine and returns PlotlyInstance
data expression contains the parameters of a default Plotly Javascript constructor
This is 1:1 correspondence to a normal Plotly API. Please see Reference
Constructor
Once called it returns PlotlyInstance
Dynamics
It fully supports dynamics, but in a different way compared to other functions. Please see for that PlotlyAddTraces, PlotlyAnimate and etc.
Examples
Scatter plot
Adapted from Ref.
trace1 = <|
	"x" -> {1, 2, 3, 4},
	"y" -> {10, 15, 13, 17},
	"mode" -> "markers",
	"type" -> "scatter"
|>;

Plotly[trace1]
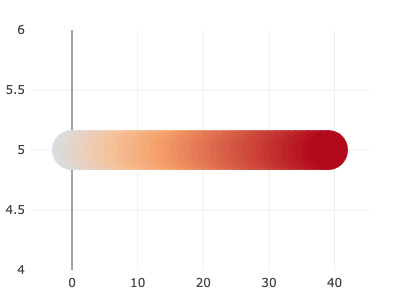
or with colors
trace1 = <|
	"y" -> Table[5, {i, 1, 40}],
	"mode" -> "markers",
	"marker" -> <|
		"size" -> 40,
		"color" -> Range[40]
	|>
|>;

Plotly[trace1]
Line charts
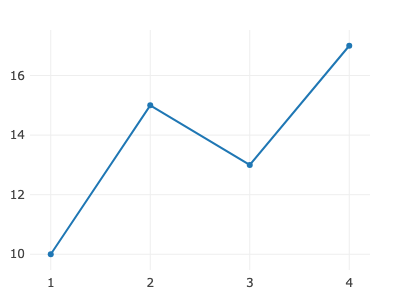
Adapted from Ref
trace1 = <|
	"x" -> {1, 2, 3, 4},
	"y" -> {10, 15, 13, 17},
	"type" -> "line"
|>;

Plotly[trace1]
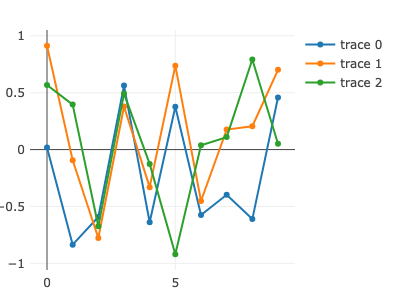
or an array of traces
trace := <|
	"y" -> RandomReal[{-1,1}, 10],
	"type" -> "line"
|>;

Plotly[{trace, trace, trace}]
Bar plot
Adapted from PlotlyJS
trace = <|
	"x" -> {"giraffes", "orangutans", "monkeys"},
	"y" -> {20, 14, 23}, "type" -> "bar"
|>;

Plotly[trace]
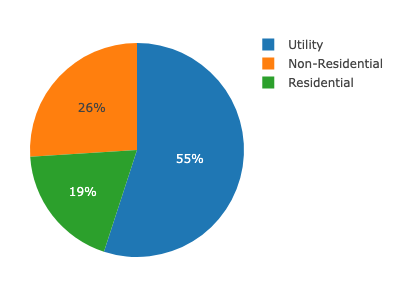
Pie chart
Adapted from PlotlyJS
trace = <|
	"values" -> {19, 26, 55},
	"labels" -> {"Residential", "Non-Residential", "Utility"},
	"type" -> "pie"
|>;

Plotly[trace]
Bubble chart
Adapted from PlotlyJS
data = <|
	"x" -> {1, 2, 3, 4},
	"y" -> {10, 11, 12, 13},
	"mode" -> "markers",
	"marker" -> <| "size" -> {40, 60, 80, 100} |>
|>;

Plotly[data]

Heatmaps
Adapted from PlotlyJS
data = <|
	"z" -> Table[x y, {x,-10,10}, {y,-10,10}],
	"type" -> "heatmap"
|>;

Plotly[data]

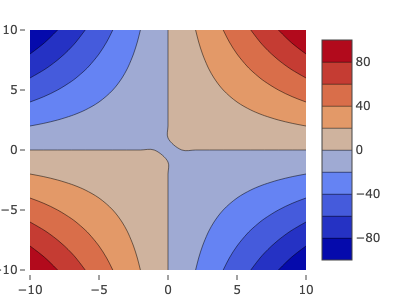
Contour Plots
Adapted from PlotlyJS
data = Flatten[Table[{x,y,x y}, {x,-10,10}, {y,-10,10}],1] // Transpose;

data = <|
    "x" -> data[[1]],
    "y" -> data[[2]],
	"z" -> data[[3]],
	"type" -> "contour"
|>;

Plotly[data]
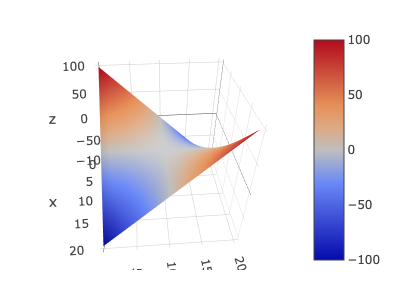
Surface plot
Adapted from PlotlyJS
data = <|
	"z" -> Table[x y, {x,-10,10}, {y,-10,10}],
	"type" -> "surface"
|>;

Plotly[data]
WebGL Scatter
A GPU accelerated scatter plot used for displaying many points
data = RandomReal[{-1,1}, {2,100000}];

Plotly[<|
  "y" -> data[[2]],
  "x" -> data[[1]],
  "mode"-> "markers",
  "type"-> "scattergl"
|>]
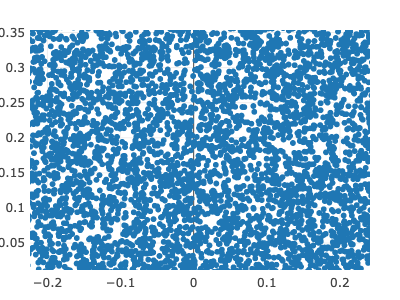
50x zoom
Many more!
Please visit PlotlyJS website
TODO
Developers notes
- Integrate events system with click events and others...