ManipulatePlot
ManipulatePlot[f_, {t, min, max}, {p1, min, max}, ..., opts___]
a dynamic alternative to Plot and Mathematica's Manipulate, that uses input elements and Offload technic to make a fast interactive plots of a given function f[t, p1, p2...]
the set of parameters are not limited and accepts the following forms
ManipulatePlot[f_, {t, min, max}, {p1}, {p2}, ...]
ManipulatePlot[f_, {t, min, max}, {p1, min, max}, {p2}, ...]
ManipulatePlot[f_, {t, min, max}, {p1, min, max, step}, {p2}, ...]
ManipulatePlot[f_, {t, min, max}, {{p1, initial}, min, max}, {p2}, ...]
ManipulatePlot[f_, {t, min, max}, {{p1, initial, label}, min, max}, {p2}, ...]
ManipulatePlot[f_, {t, min, max}, {p1, values_List}, {p2}, ...]
ManipulatePlot[f_, {t, min, max}, {{p1, initial}, values_List}, {p2}, ...]
ManipulatePlot[f_, {t, min, max}, {{p1, initial, label}, values_List}, {p2}, ...]
where f can return _Real or {__Real}
Options
"SamplingPoints"
A number of points used in sampling. The default value is 200
It inherits some of Graphics options as well
TransitionType
See TransitionType
TransitionDuration
ImageSize
Accepts {width, height}
PlotStyle
Specifies colors for each curve
Epilog
Prolog
Appends graphics primitives to the plot. See Graphics
Example
Plot the simplest sine function
ManipulatePlot[Sin[w z + p], {z,0,10}, {w, 0, 15.1, 1}, {p, 0, Pi, 0.1}]
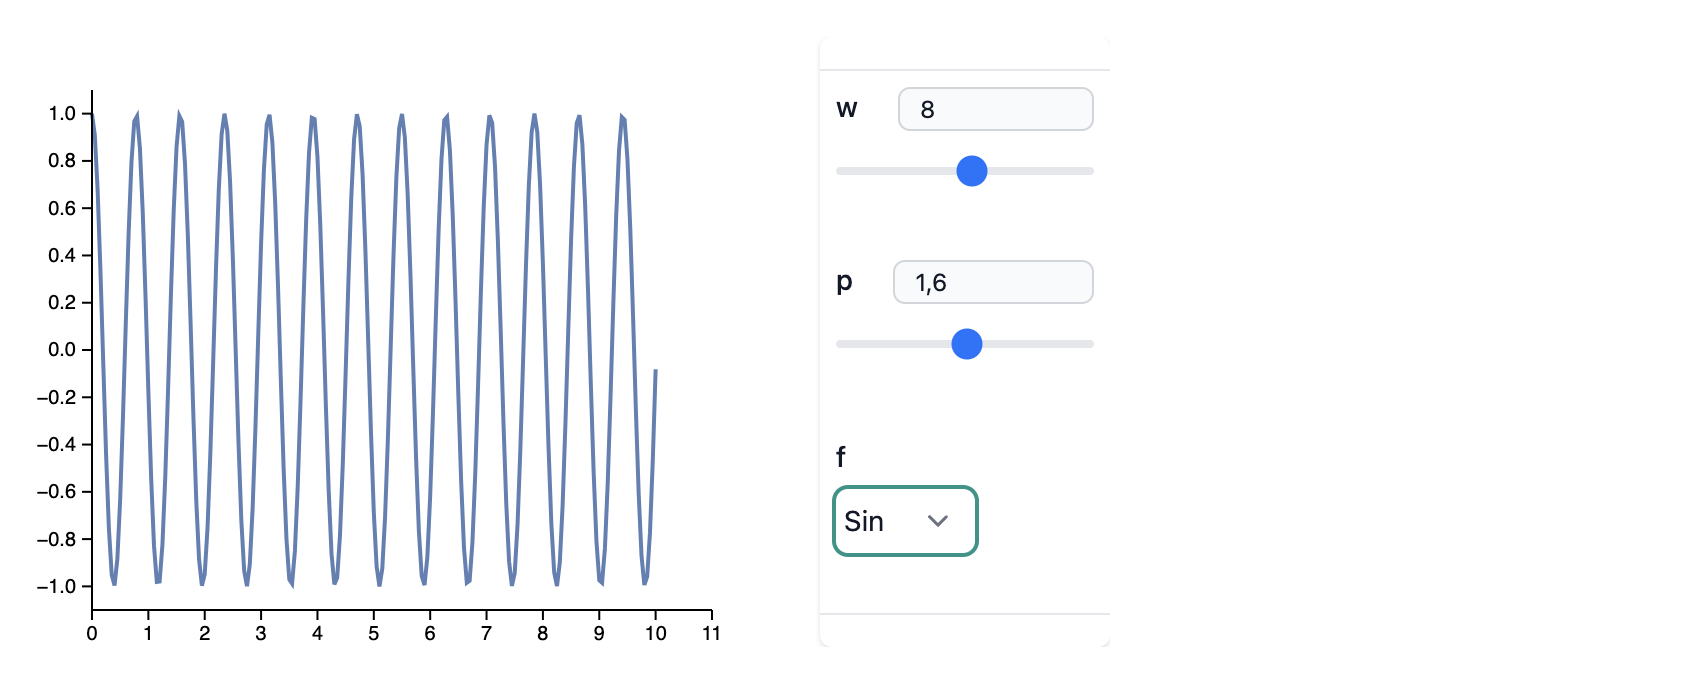
Or give a choice to a user
ManipulatePlot[f[w z + p], {z,0,10}, {w, 0, 15.1, 1}, {p, 0, Pi, 0.1}, {f, {Sin, Cos}}]
Issues
danger
Help needed!
There is no adaptive sampling implemented.