
The notebook focuses on tracing and animating the contours of GIF images using WLJS Notebook.
Firstly, import as a usual file
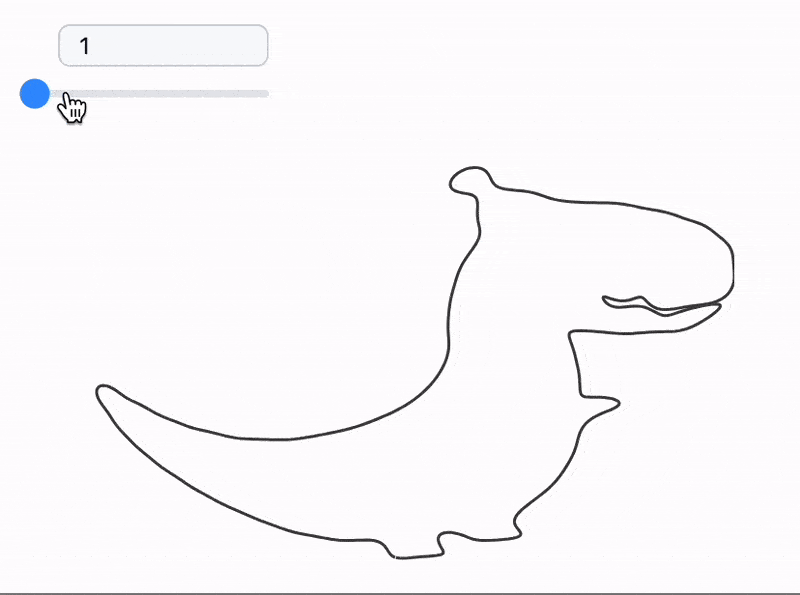
Now in imgs we have a sequence of images. In our case this is a dinosaur

the source is unknown, sorry
To trace all contours we adapt a method from @anderstood on StackExchange
A custom function trace[ii_] is defined to process each image frame.
trace[ii_] :=
Module[{img, pts, z, m, n, cn, f, g},
  img = ii;
  img = Binarize[img~ColorConvert~"Grayscale"~ImageResize~500~Blur~3];
  pts = DeleteDuplicates@Cases[Normal@ListContourPlot[Reverse@ImageData[img],
       Contours -> {0.5}], _Line, -1][[1, 1]];

  z = pts[[All, 1]] + I*pts[[All, 2]];
  m = 50;
  n = Length@z;
  cn = 1/n*Table[Sum[z[[k]]*Exp[-I*i*k*2 Pi/n], {k, 1, n}], {i, -m, m}];
{f[t_], g[t_]} = {Re@#, Im@#} &@
    Sum[cn[[i + m + 1]]*Exp[I*i*t], {i, -m, m}] // ComplexExpand;
  Function[t, {f[t], g[t]}]
]
In a nutshell it does:
- Binarizes and processes the image.
- Extracts contour points using the data from
ListContourPlot(kinda a hack 😃). - Performs Fourier analysis to create a smooth curve representation.
- Returns a parameterized function of the contour.
Frame processing
Then we need to process each frame like that
frames = Map[With[{f = trace[#]},
  Table[f[p], {p,0,2Pi,0.01}]
]&, imgs];
it might take a while
The processed frames are animated with a slider as follows
currentFrame = frames // First;

EventHandler[InputRange[1,Length[imgs], 1, 1], Function[v,
	currentFrame = frames[[v]]
]]

Graphics[Line[currentFrame // Offload]]
However we can go further and analyze each color plotting a separate curve for it.
Color separation
To find dominant colors use can follows this approach
img = imgs // First;

(* Convert Image Data to a List of Colors *)
colors = ImageData[ImageResize[img, 200], "Byte"];
colorsList = Flatten[colors, 1];

(* Cluster Colors Using KMeans *)
clusters = FindClusters[colorsList, 4, Method -> "KMeans"];

(* Extract and Visualize Dominant Colors *)
dominantColors = Map[Mean, clusters];
dominantColors = Select[dominantColors, Norm[#[[;;3]]]>10 &];
dominantColorsRGB = RGBColor /@ (dominantColors / 255)
as a result we have
On the next step we will convolve those colors with an image
Clamp[val_List, max_] := Clamp[val//First, max]
Clamp[val_, max_] := If[val > 0.5, 1, 0] max

colorSeparate[img_, colors_] := Table[Map[
  Map[
    Function[pixel,
      Clamp[i[[;;3]] . pixel[[;;3]] / 255.0, 1]
    ]
  , #]&
, img // ImageData] // Image, {i, colors}]
ImageResize[#, 100] &/@ colorSeparate[img, dominantColors]

Animating each color channel separately
Firstly we will apply curve extracting on each channel of the frame
framesColored = Table[Map[With[{f = trace[#]},
  Table[f[p], {p,0,2Pi,0.01}]
]&, colorSeparate[frame, dominantColors] ], {frame, imgs}];
currentFrameColored = framesColored // First;

EventHandler[InputRange[1,Length[imgs], 1, 1], Function[v, currentFrameColored = framesColored[[v]]]]

Graphics[
  Table[
    With[{i=i},
      {dominantColorsRGB[[i]], Polygon[currentFrameColored[[i]] // Offload]}
    ]
  , {i, Length[dominantColorsRGB]}] // Reverse
]
Here we use Polygon instead of Line to get filling for each closed curve. An algorithm did not work well for all colors and we effectively have only two instead of 3

Try it on your images!