Dynamic HTML
A user does not need any app installed to drag some sliders on your notebook
This feature is quite experimental. Please, read the manual carefully
This is a dynamic version of exporter Static HTML, which is aimed to recreate full interactivity of the normal notebooks

Use cases
- All use cases of Static HTML
- Demonstration project
- Live animation of some physical process
How it works
It order to make the system more general and be able to capture the effects of ManipulatePlot, any combinations of InputRange, InputButton, Offload and many more it is abstracted by the design from the controlling elements and purely analyses the events and mutations of symbols.
It requires the architecture of your dynamic system, which follows the principle of call and response, i.e. it must generate (by a user or automatically) an event from the input element or any other code on the frontend and then generate the corresponding response as a mutations of symbols used from the Wolfram Kernel.
TLDR; We record the calculated data for all possible combinations of input elements used and store it in a large table. See how to do this in How to use section
Details
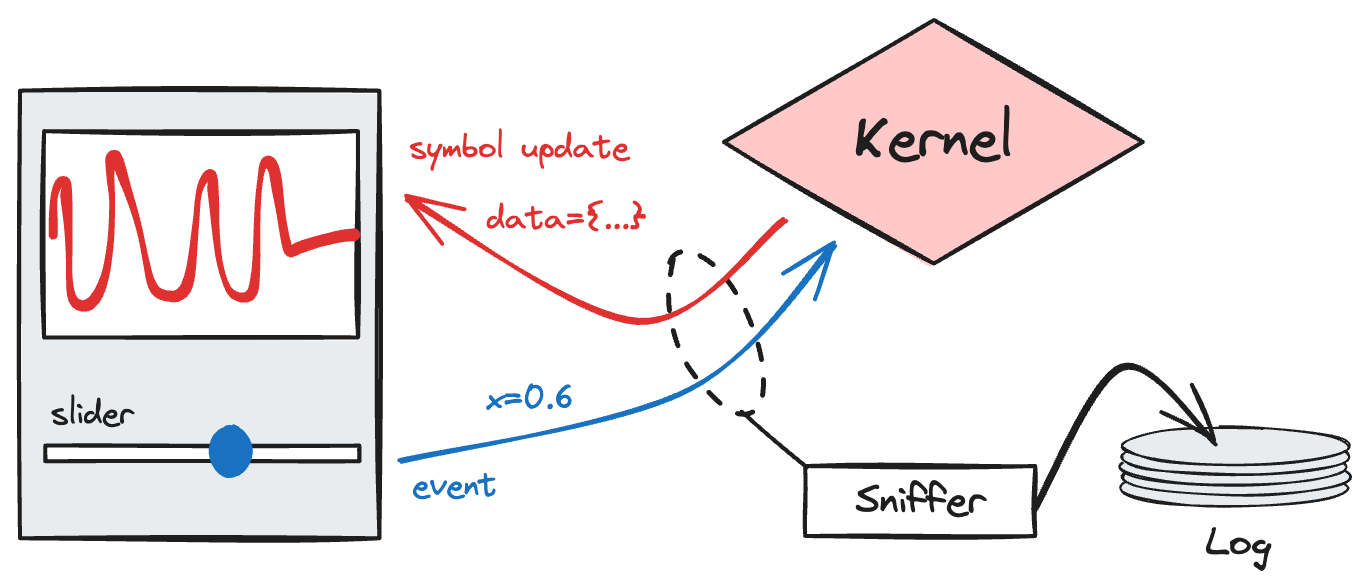
Sniffer
All magic happens on the frontend in Javascript. The first stage it is to record all events fired by server.kernel.io.fire (see here API reference), which is a part of JerryI`Misc`WLJS`Transport core package, that provides an easy interface between kernel events system and Javascript together with symbols mutations. .fire() method is used in all built-in input elements such as InputRange, InputText, InputJoystick (see an example on how to built your own in Communication guide) and even AnimationFrameListener. Symbols mutations are recorded only for ones wrapped in Offload, which is a usual case scenario for any kind of Dynamics in WLJS Notebook
Analyser
Since Wolfram Engine is single threaded as well as Javascript, it is easy to spot a correlation between events and symbols mutations. For example let us have a look at the recorded time-series
A 1 B 2 C 1 2
here A, B, C are some arbitrary event and 1, 2 are symbols mutations. By analyzing this series it is easy to guess that the connections are following
Amutates1Bmutates2Cmutates1and2
It also accounts for a possible delay and "noise" (rare events from other subsystems you don't want to include to your exported notebook) in computing, i.e.
A 1 B B B 2 2 2 V C 1 2 C C 1 2 1 2 A B 1 2
will also be processed correctly assuming you have enough sampled data. By also analyzing the payload of each call, system can make a guess
A 1 A 1 A 1 A 1 A 1 ... 20-60 times per second
if the payload of an event A is the same, then 1 is most likely a frame of some animation constructed using AnimationFrameListener.
If we know from this data all connections and the range of values for each event, it will be enough to reproduce this behavior offline using look-up tables and state machines.
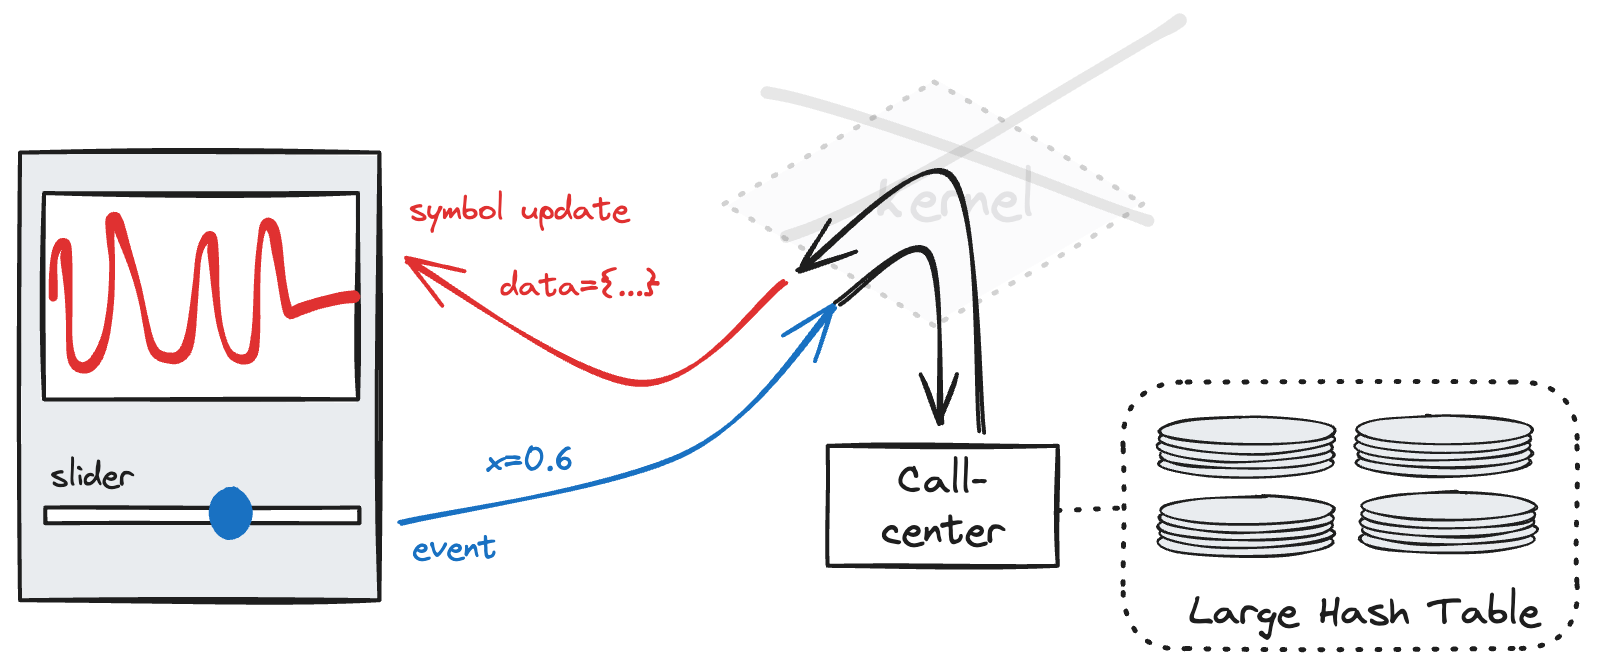
Sampler
After all connections are known, the idea is to sample the data of symbol mutations using all combinations of events recursively. This is not the best solution, since having 1 checkbox and 2 sliders (with 10 positions for instance) already gives 200 sampling points. If an animation process is not detected, an automatic sampling will be applied starting from the current state of a system
*.emitt('A', 1)               //manually fire
                              //wait for 1
* mutation('1', {new data 1}) //collect
*.emitt('A', 2)               //manually fire
                              //wait for 1
* mutation('1', {new data 2}) //collect
...
*.emitt('B', 1)               //manually fire
                              //wait for 2
* mutation('2', {new data 1}) //collect
...
*.emitt('C', 1)               //manually fire
                              //wait for 1 & 2
* mutation('1', {new data 3}) //collect
* mutation('2', {new data 3}) //collect
...
After all data has been harvested, it is translated into a big hash map with each entity corresponding to single state of a system - sort of a loop-up table. The state is determined by the sum of hashes (fingerprints) of all fired events including the their payload
In this implementation it is impossible to mimic Markov chains or other systems with internal state and a history (hysteresis loops).
Then a sampler compresses all data using zlib and packs it together with an exported notebook to a single HTML file including the supporting code for .
How to use
Please follow the steps listed below
Prepare notebook
Connect to Wolfram Kernel, do normal evaluation of your dynamics. Try to minimize the number of input elements and their possible states. For example, do not put 3 slider (InputRange) with 100 steps for each. If you use ManipulatePlot, specify explicitly step for your parameters. The same counts for number and size of used dynamic symbols.
If you record an animation constructed using AnimationFrameListener, start it right before going to the next step. Note, that the effects of SetInterval as well as FrontSubmit will not be recorded at all.
For example, we can try ManipulatePlot for the simplicity
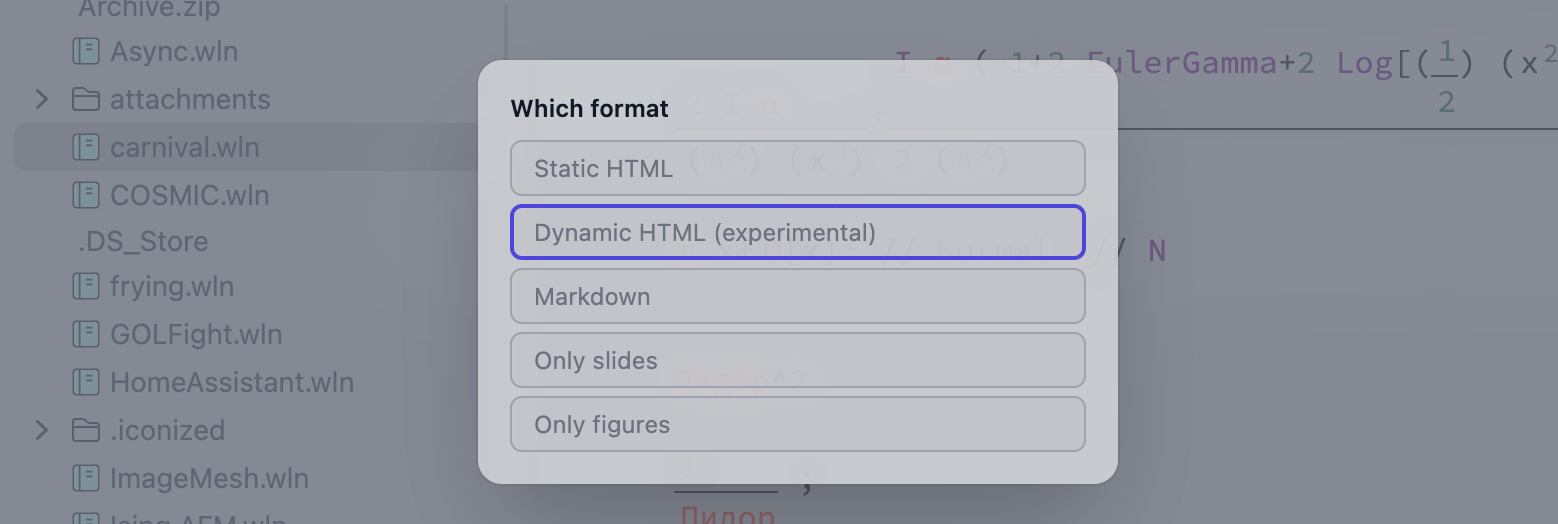
Sniffing phase
Click Share and pick Dynamic Notebook, it will automatically initiate recording. A widget should appear in the top-right corner
If you record an animation. Just evaluate the corresponding cell and wait number of frames you want to be recorded, then click Continue on the widget
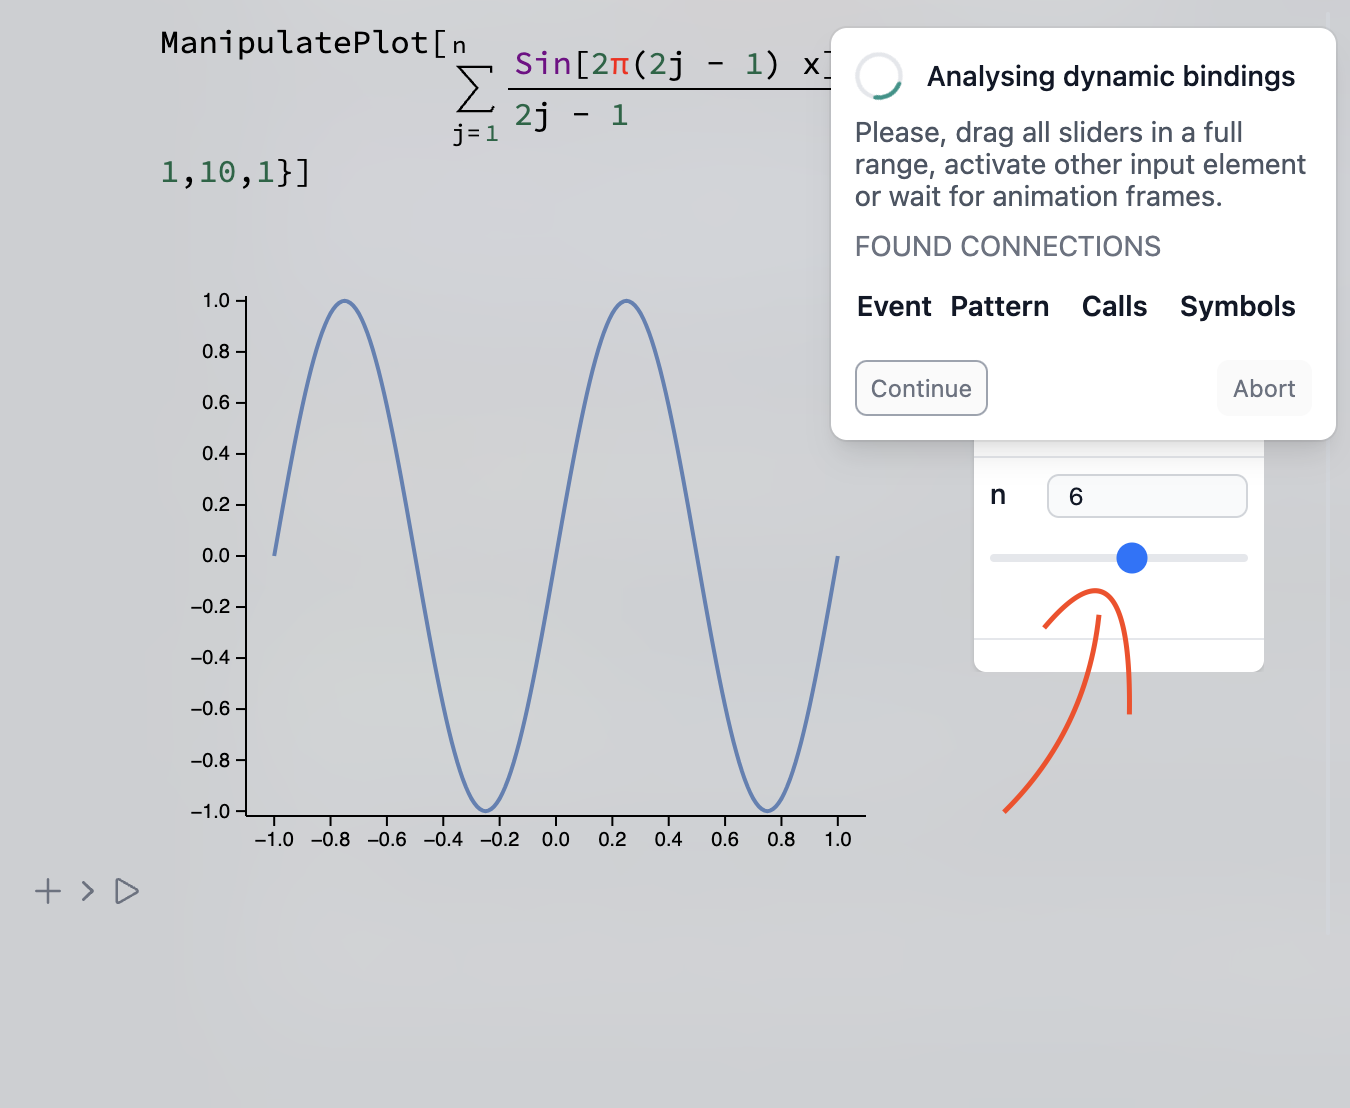
Now drag a slider in all ranges. It is important to cover all positions of it, since while sampling phase it will only use values it had during Sniffing phase.
If you have multiple input elements (2, 3 sliders). Drag each individually in full range one time. Cross combinations are not necessary, since they will be sampled automatically recursively on the next stage by the system.
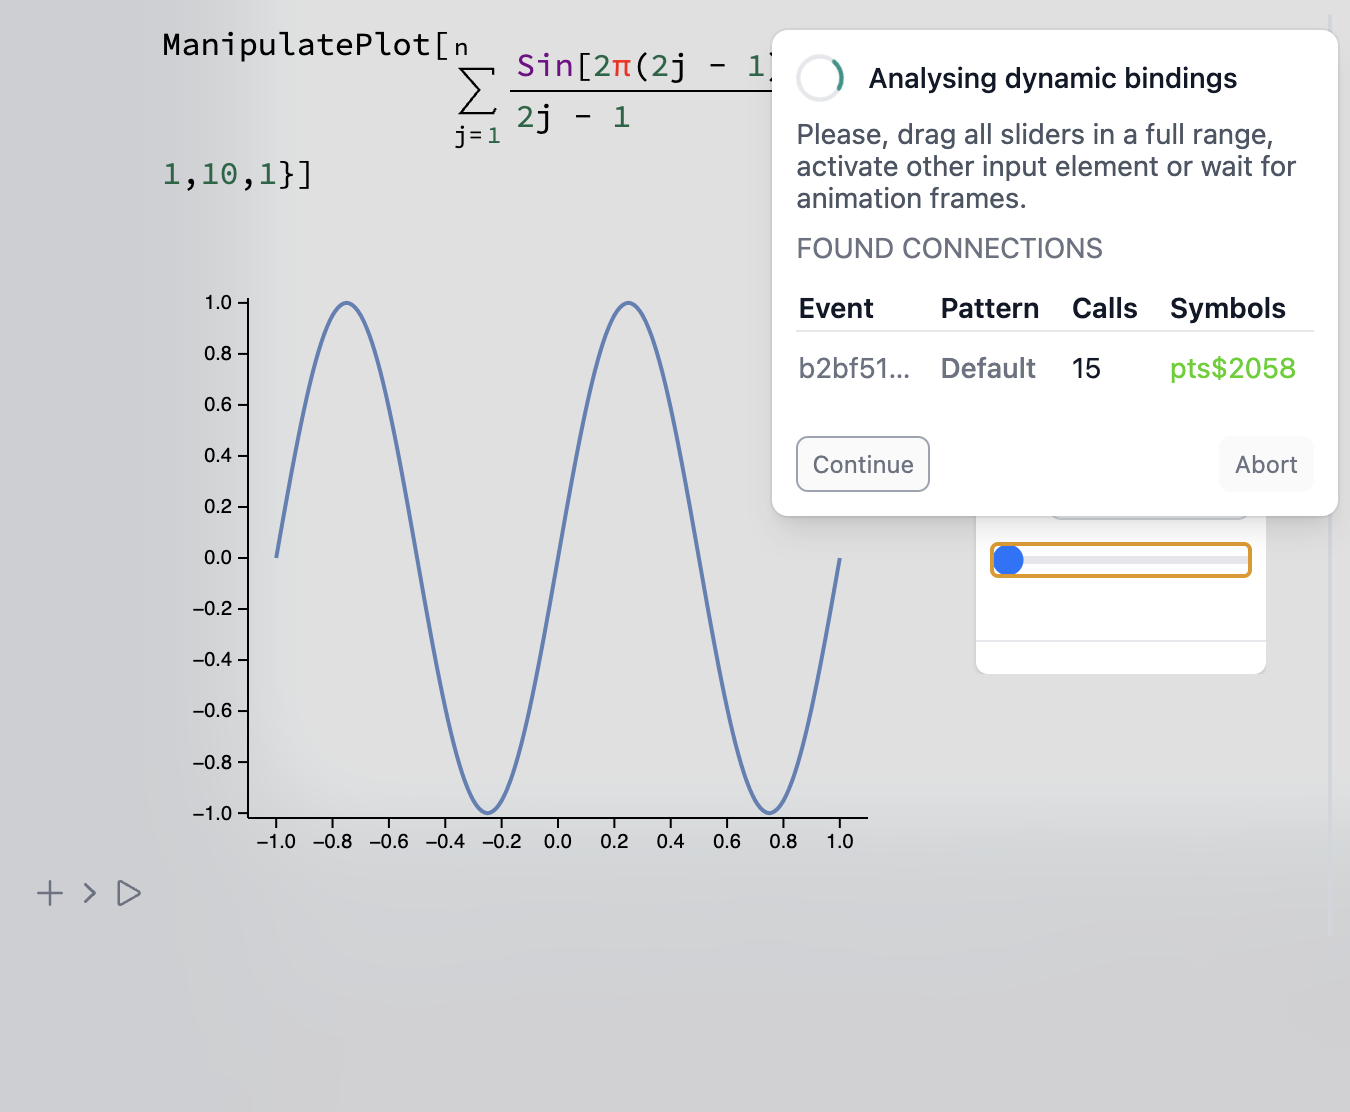
Now you see found connections between symbols and events. Their names do not manner, since it is autogenerated by ManipulatePlot. Make sure they become green, which means a good confidence in the corresponding bond.
Sampling phase
Now it samples all combinations automatically, it might take some time depending on how complex your calculations
This is the last stage. On the next step it will export your notebook with this data to your drive. Click Continue
Result
Depending on how many sampling points you have, the average file size is about 7-20 Mb and 3-15 Mb of you set CDN in the settings (see Static HTML). An example above costs only 165 kB uncompressed and 50 kB compressed data.
The result is fully interactive widget working offline without internet connection and any Wolfram Kernel ✨
Examples
See some interactive examples from our blog page and demonstration project