Prototyping
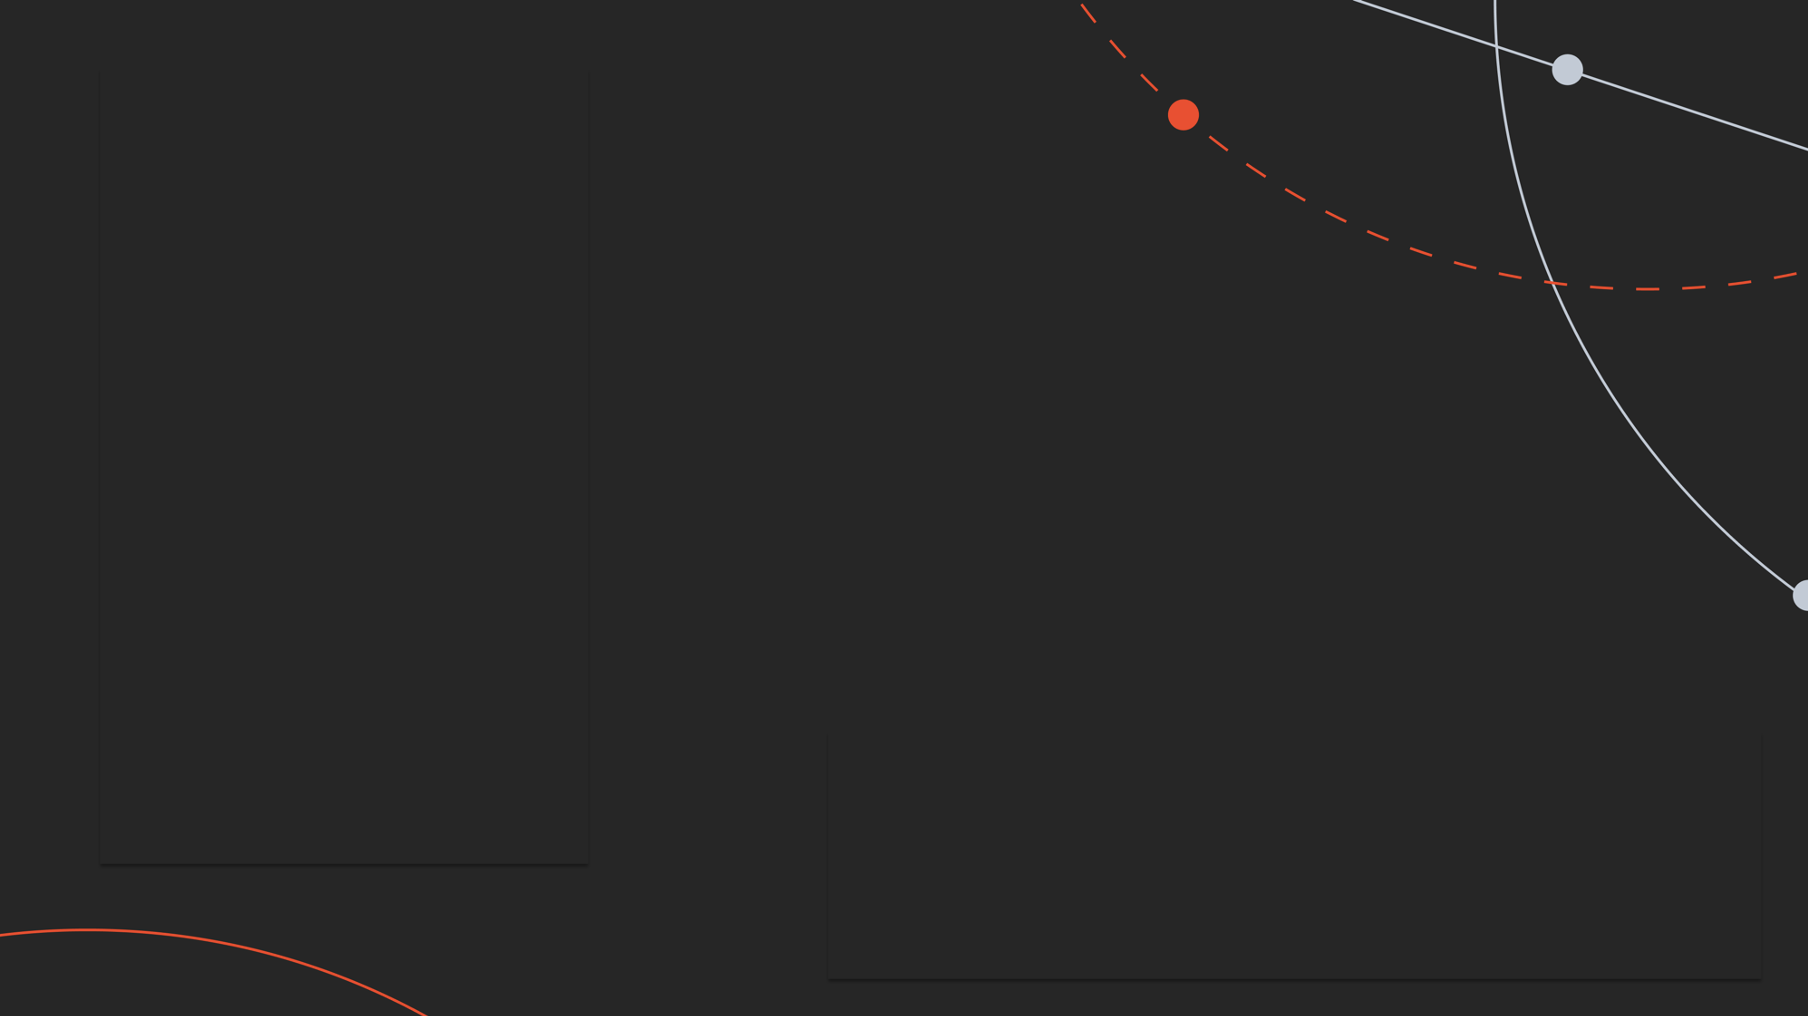
Imagine we want to recreate this background used in some presentation

From the first sight, it looks like a few circles with a huge radius with dashed lines and three Disk s. To program this manually would be cumbersome, however, we can create our own tools for this specific task in a few lines.
Placing objects
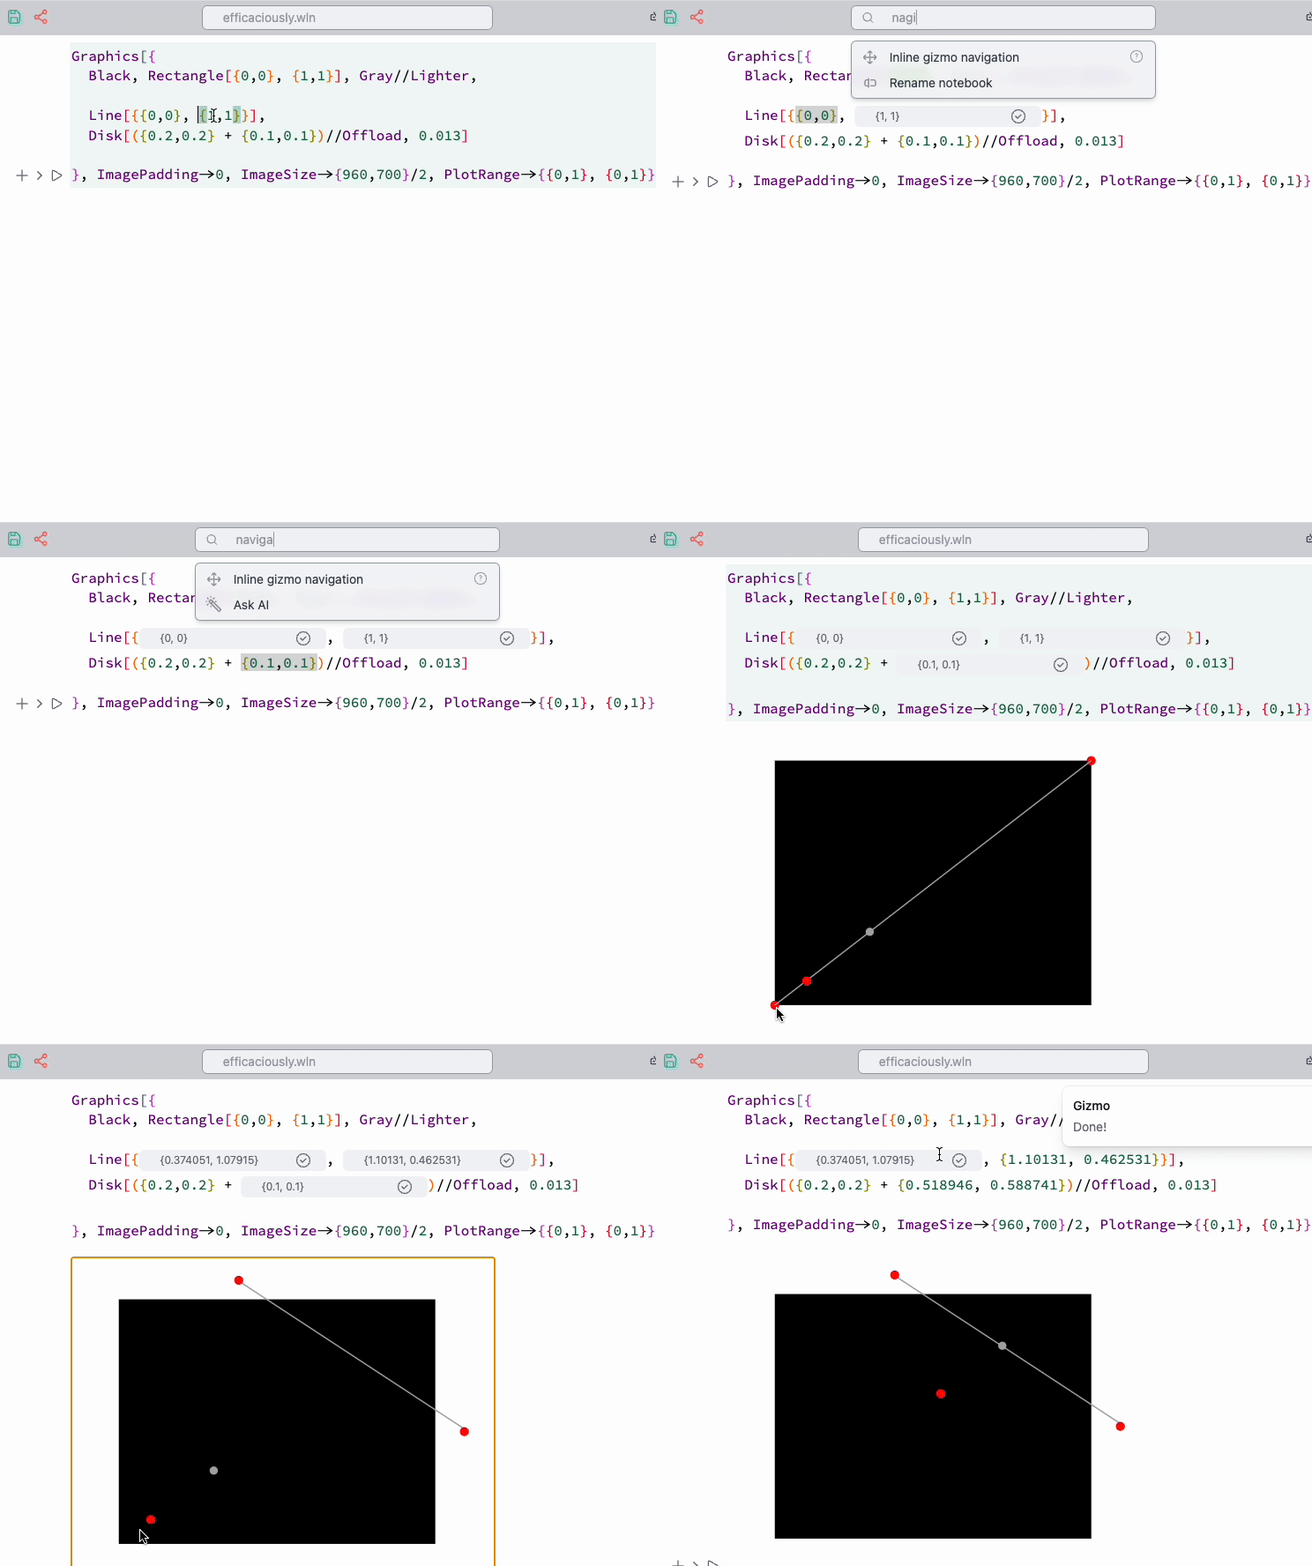
Here we use Navigation gizmo to assist us in placing straight lines and disks
then select the highlighted regions and run in the command palette navigation ... on the selected

It is better to add offsets to the positions, like we did with Disk
then your navigation gizmo will not overlap with an actual graphics primitives you are positioning.
Parameterized curves
Let us have a look at some curves
a prototype for circles
curveGenerator[pt1_, pt2_] := Line[With[{
  radius = pt1,
  pos = pt2
},
  Table[Norm[pos - radius]{Sin[i], Cos[i]} + pos, {i, 0, 2Pi, 0.1}]
] // Offload]
what it does, it will produce a circle defined by two points. The feature here is it accepts any symbol as pt1 / pt2 including dynamic one. Since all internals of Line including Table is wrapped into Offload it will be calculated directly on the frontend (aka WLJS Interpreter), while Wolfram Kernel only provides the values for those two control points.
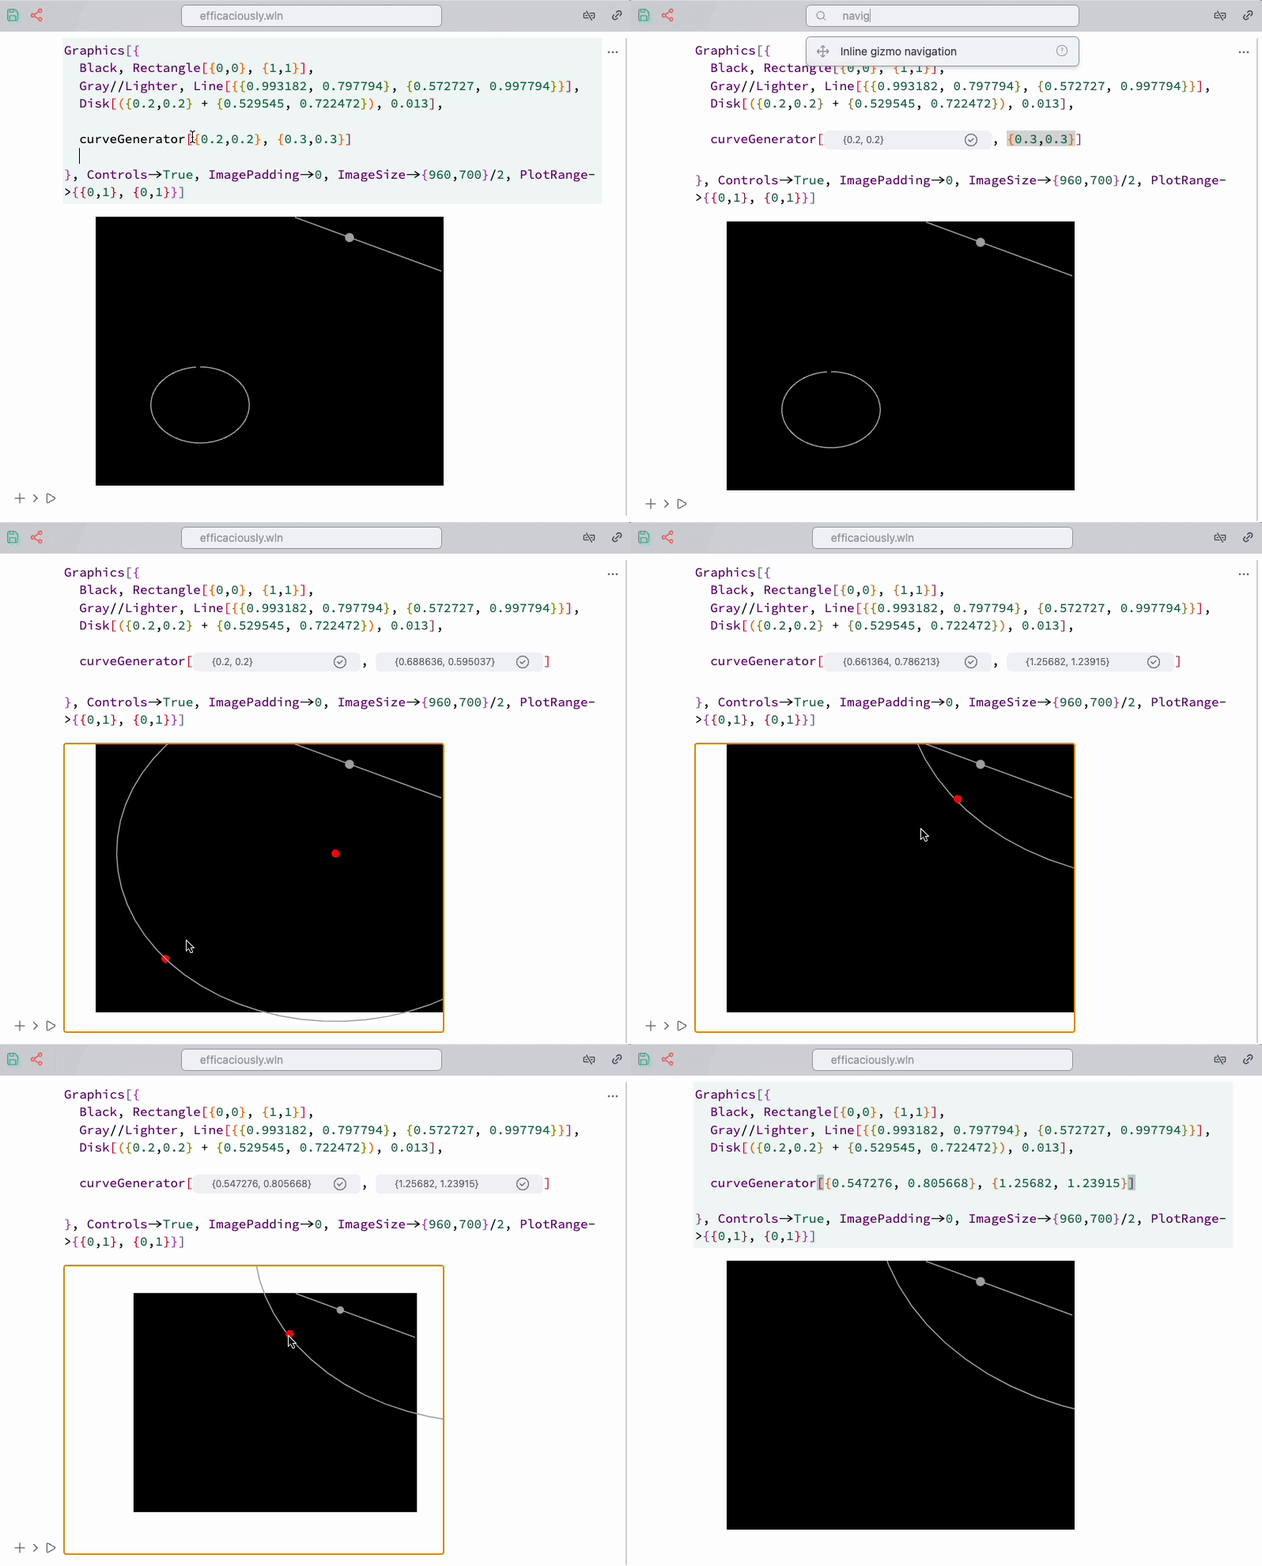
To assist us, one can use Navigation gizmo snippet form the command line palette, which automatically generates temporal dynamic symbol and a gizmo for it
apply it from the command palette to selected as it is demonstrated on a GIF below

Once we placed all objects, why not to animate them as well?
Animation
For this case we need to alter curveGenerator a little bit
ClearAll[curveGenerator];

curveGenerator[radius_, center_, dashed_:False] := With[{
  cell = ResultCell[]
}, LeakyModule[{
  pts = Table[Norm[center - radius] {Sin[i], Cos[i]} +
         center, {i, 0, 2 Pi + 0.1, 0.1}],
  pt = {10,10},
  modulation = 0.,
  phase = 0.,
  task
},

  EventHandler[cell, {
    "Destroy" -> Function[Null, Print["Destroy"]; TaskRemove[task]]
  }];

  task = SetInterval[
      pts = Table[(Norm[center - radius] + 0.02 modulation Sin[50. i + 30 phase]) {Sin[i], Cos[i]} +
         center, {i, 0, 2 Pi + 0.1, 0.01}];

         pt = With[{i = 3. phase},(Norm[center - radius] + 0.01 modulation Sin[50. i + 30 phase]) {Sin[i], Cos[i]} +
         center];

      phase = phase + 0.02;
      modulation = Sin[phase/2];
  , 100];

  If[dashed // TrueQ,

    {SVGAttribute[Line[pts // Offload],"stroke-dasharray"->"10"], Disk[pt // Offload, 0.013]}
  ,

    {Line[pts // Offload], Disk[pt // Offload, 0.013]}
  ]
] ]
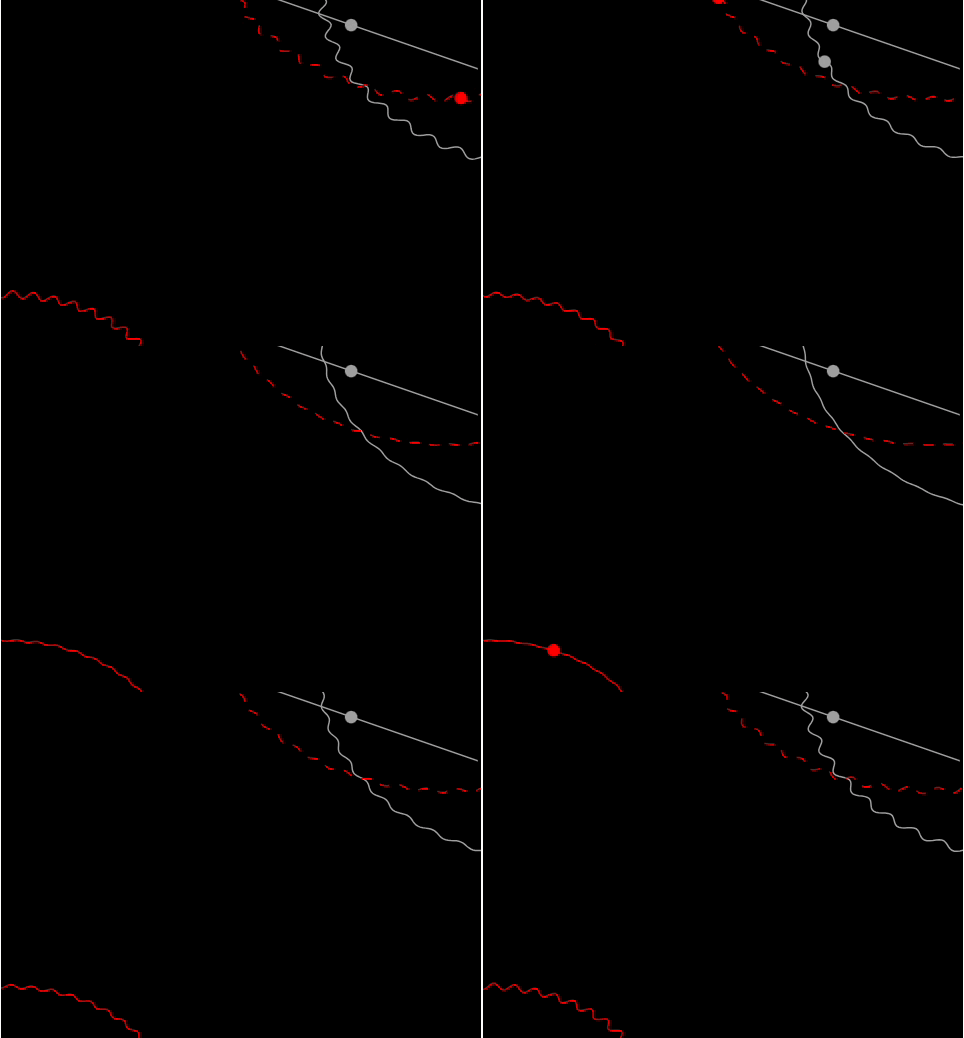
Now it uses SetInterval to animate the curves with 100 ms interval and removes the task if an output cell got destroyed. If we put all together as follows
Graphics[{
  Black, Rectangle[{0,0}, {1,1}],
  Gray//Lighter, Line[{{0.993182, 0.797794}, {0.572727, 0.997794}}],
  Disk[({0.2,0.2} + {0.529545, 0.722472}), 0.013],

  curveGenerator[{0.990909, 0.545221}, {1.19545, 1.03346}, False],
  Red, curveGenerator[{0.584091, 0.861075}, {0.934091, 1.19931}, True],
  curveGenerator[{0.305086, -0.0154444}, {0.00942938, -0.189671}, False]

}, Controls->True, ImagePadding->None, ImageSize->{960,700}/2, PlotRange->{{0,1}, {0,1}}]
we will get a nice animation for a title slide of your presentation

You can also play with an interval and TransitionDuration option of Graphics to get smoother animation.